

Quarterly Publication - January 2017
International portfolio update - January 2017

The event that overshadowed financial markets this past quarter (and for that matter, the entire 2016) was the election of Donald Trump as the 45th US president. For the second time during the 12-month period, opinion polls got the final result of a major election or referendum dead wrong. While commentators were united in expecting the worst for equity markets in the event of a shock result, the opposite happened. The market upheaval has been spectacular, and these newly established trends were continuing to play out at the time of writing.
Equity markets declined sharply for a short while on 9 November 2016 (the day after the US presidential election), but the Standard & Poor’s (S&P) 500 Index closed the day up 1.1%. Since the election date, the S&P 500 Index has gained more than 6%. However, the most volatility has been experienced within sectors. Trump’s promises and threats regarding taxes and global trade reverberated across the markets with spectacular results.
Financial shares (more specifically banks) stood out and outperformed strongly, with the sector being up 21% for the quarter. This rally was fuelled by the promises of higher economic growth, lower effective tax rates and less regulation.
Most cyclical shares rebounded, especially those that should benefit from the promised infrastructural investment programme and the ‘Made in the USA’ initiative. The energy sector benefited from both the anticipation that less regulation will facilitate volume growth and a renewed effort by the major oil producers to curtail production to prop up the oil price. The losers in this rotation exercise were healthcare (even though a Clinton election would arguably have been worse for the sector), consumer staples (also impacted by a sharp increase in long-term interest rates, discussed below in more detail) and information technology (although this sector should benefit from the proposed capital repatriation relaxation).
Some of these themes had a significant impact on other assets classes. The promise of stronger economic growth, lower tax rates (implying a higher budget deficit) and some hawkish comments in response to the actions of the US Federal Reserve led to a sharp adjustment in interest rate expectations. The US ten-year yield moved from 1.85% on election day to 2.05% two days later, and finished the year at 2.44% − a massive adjustment of 60 basis points in a very short space of time.
Expectations for short rates also kicked up, albeit not as dramatically. As a result of these moves, the real estate sector sold off, becoming the second worst performing sector over the quarter after healthcare. The US dollar strengthened from more than $1.10 to the euro to its current level of around $1.05, but emerging market currencies perversely strengthened on the prospect of better global economic growth. The gold price fell from $1 275 to a low of $1 130 on higher inflationary expectations and the stronger US dollar, while most commodity prices (especially copper) rose.
All of this culminated in one of the most memorable quarters in financial markets in recent history. The global index (MSCI All Country World Index) returned 1.2% over the quarter and 7.9% for the last year. Within developed markets, the UK was a notable underperformer, given the continued uncertainty after the Brexit vote.
Over the course of 2016, US equities performed strongly, outperforming the global index by around 4%. While emerging equity markets underperformed during the final quarter of the year as Chinese stocks declined on Trump’s anti-China rhetoric, they still outperformed the global index by 4.5% over the year. Brazil and Russia were the two stand-out performers of 2016, supported by both currency strength and a strong equity rerating.
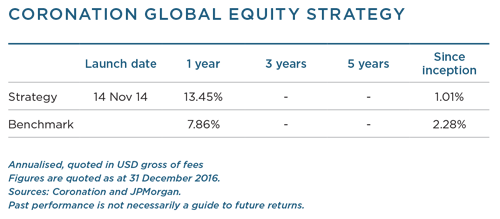
The strategy performed well against this volatile backdrop. Its quarterly return of 2% outperformed the benchmark by 0.8%. More importantly, the strategy’s annual return of 13.5% outperformed the benchmark by a very respectable 5.6%. This was a very satisfying outcome given the strategy’s poor relative performance in 2015.
The strategy has now clawed back almost all of the initial underperformance since its launch in November 2014. We remain committed to not only erase this deficit, but to also justify our active approach to asset management by achieving positive alpha over the medium to longer term.
Another satisfying feature of our more recent returns is the higher hit ratio we achieved over the past quarter. This ratio of 1.57, which represents the strategy’s winners relative to losers in terms of individual stock positions, is the highest since inception. While the ratio in itself does not guarantee good performance (it is far more important to avoid big losers and upsize your winners), it is indicative of an investment process that adds value in terms of tilting the odds of outperformance in our favour. As a matter of interest, this number is still below one since inception, as initially a number of our emerging market positions cost us dearly.
For the quarter, most of our positions in the more cyclical shares and alternative asset managers made a positive contribution to performance. Notable contributors include KKR, Apollo Global Management and Blackstone, as well as Tempur Sealy, American Express and the strategy’s US airline positions.
TripAdvisor continued to disappoint (after another poor set of results), while some of our technology positions such as Amazon and Facebook suffered from the vicious sector rotation. The fact that the strategy still outperformed, despite being materially underweight US banks, shows that the bulk of the rest of the portfolio was very supportive.
The biggest contributors to the strategy’s strong performance were Kroton/Estácio (Brazilian education companies currently merging), Apollo Global Management (with the alternative asset manager having bounced back strongly after a prolonged period of poor share price performance), NetEase (a Chinese gaming company subsequently sold after a very strong share price rerating), Charter Communications (still a big position within the strategy) and Urban Outfitters (which we sold out of and recently reintroduced into the portfolio).
Losers over the period include TripAdvisor, JD.com (a Chinese e-commerce operator still building scale), LPL Financial Holdings (a financial advisory business sold after disappointing operational and strategic results) and Pershing Square (the listed vehicle of the prominent investor Bill Ackman, and still one of the strategy’s biggest positions).
Investors who follow the portfolio closely will notice that for the first time since inception we have added meaningfully to the so-called consumer staple sector. We added roughly 8% of the portfolio to a basket of these shares during the quarter.
The biggest buys include British American Tobacco (1.7%), Anheuser-Busch InBev (1.4%), Unilever (1.2%) and Heineken (1.2%). Seeing that we expect the long bond yield in the US to continue rising over the next few years, we might get more opportunities to buy some of these high-quality companies at attractive valuation levels, and we are standing ready to do so. However, we will always be conscious of valuation, wanting to pay a fair entry price, as this will be the key determinant in whether a holding will add value to the overall portfolio performance.
The global economy and markets enter 2017 on considerably firmer footing than last year. However, markets have moved quickly to reprice assets that should benefit from this improved outlook.
As such, we have become slightly more conservative in our portfolio positioning. The aforementioned holdings in consumer staples have added to the reduced risk profile. We have also bought some put options to protect the strategy against unforeseen hiccups, as the cost of these protection strategies remains attractive, in our opinion.
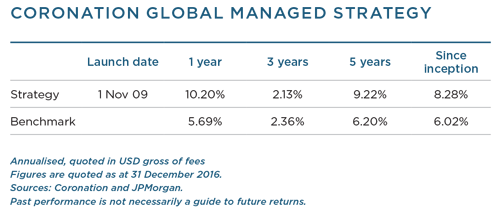
The strategy performed well against the volatile backdrop (as discussed in the Global Equity Strategy commentary). Its quarterly return of 0.6% outperformed the benchmark by a significant 2.8%. More importantly, the strategy return of 10.2% exceeded the benchmark return by a very satisfying 4.5% for the 12-month period. This was a very gratifying outcome, given the strategy’s poor relative and absolute performance in 2015. Since inception more than six years ago, the strategy has outperformed its benchmark by just more than 2% per annum on a gross basis − a noteworthy performance.
The robust performance over the last year was partly due to very strong equity selection, with the strategy’s equity carve-out outperforming the MSCI All Country World Index benchmark by a strong 6%. This was also due to a pleasing result from our merger arbitrage bucket, which returned 14.3% for the year. At year-end, we still had a few positions open, but the opportunity set has shrunk somewhat.
In addition, by being very hawkish on the outlook for developed market government bonds, and therefore hedging out the interest rate risk in our credit holdings, we have managed to avoid the bulk of the bond market carnage over the quarter. As an illustration, our credit carve-out returned a very marginal -0.1% over the quarter, and a pleasing 7.7% for the year.
The negative contributors to performance include our property holdings (particularly over the last year) and our position in physical gold. The gold position was only initiated during 2016, and was considered a form of protection or diversification, but the poor performance in the price of gold was still disappointing. We also held a few protection strategies against our physical equity holdings which, given the Trump rally, have cost us some insurance premium. We will continue to add some protection to the portfolio to manage overall risk.
Within equities, most of our positions in the more cyclical shares and alternative asset managers contributed positively over the quarter (as highlighted in the Global Equity Strategy commentary).
Within property, we have reduced some of our positions, but also added to other holdings such as Cromwell (as the market sold off during the first six weeks of the quarter). We continue to monitor opportunities in the US, but have not acted on any as yet. In terms of credit, we are in the process of reducing the strategy’s exposure, as the Trump rally has positively impacted credit spreads. In turn, we have added to our gold position over the quarter into price weakness.
Frontier markets produced a mixed performance over the quarter. Sri Lanka, which is now the strategy’s largest country exposure, was down 6.7%. Egypt (our second largest country exposure) fully embraced its move to a floating exchange rate regime in November 2016, the short-term impact of which resulted in a 51% currency devaluation and a drag on the strategy’s performance over the period.
The decision to float the currency, coupled with subsidy removal and a $12.4 billion International Monetary Fund deal, sees the economy completely reset and the country well positioned for growth. The Egyptian market was down 24.4%, despite the market increasing 54.4% in local currency terms over the quarter.
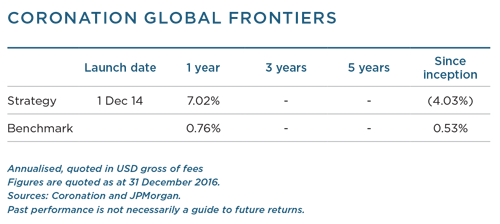
In contrast, there was strong demand for equities in Zimbabwe, partly due to the introduction of the new ‘bond notes’, which resulted in the Zimbabwean market being up 46% for the quarter. Pakistan gained 18%, while Bangladesh was up 7.3%. Against this backdrop the strategy was flat (0.1%), compared to the 3 Month USD Libor, which was up 0.2% and the MSCI Frontier Markets Index, which rose 0.5% for the quarter.
2016 as a whole also saw a mixed performance across the frontier universe: Pakistan (+46.4%), Morocco (+27.4%), Zimbabwe (+25.8%), Vietnam (+14.8%) and Bangladesh (+9.0%) all did well, while Egypt (-25.5%) and Nigeria (-40.7%) were negative, largely due to significant currency devaluations during the year. Sri Lanka returned -12.6%. For 2016, the strategy delivered +7%, which is well ahead of both the 3 Month USD Libor (+0.8%) and the MSCI Frontier Markets Index (+3.2%).
The largest contributors to performance in 2016 were Guararapes (a Brazilian clothing retailer) and Beximco (a pharmaceutical company in Bangladesh), while the largest detractors were Bulgartabac (a Bulgarian tobacco company) and Qalaa Holdings (an Egyptian conglomerate with interests in energy assets).
Due to a tough 2015 for frontier markets in general, the strategy’s annualised return since inception is -4.0%. This is lower than the 3 Month USD Libor, which returned +0.5%, but comfortably ahead of the -7.5% recorded by the MSCI Frontier Markets Index.
In 2016, the shining light in global frontier markets was Pakistan. The strong performance of the Karachi Stock Exchange 100 Index (up 46.4%) has been driven by an expansion in energy supply, excitement around the China Pakistan Economic Corridor (CPEC), security improvements and the announcement that MSCI will be upgrading Pakistan to emerging market status in 2017. Pakistan comprises 9.4% of the strategy, making it our third largest country exposure.
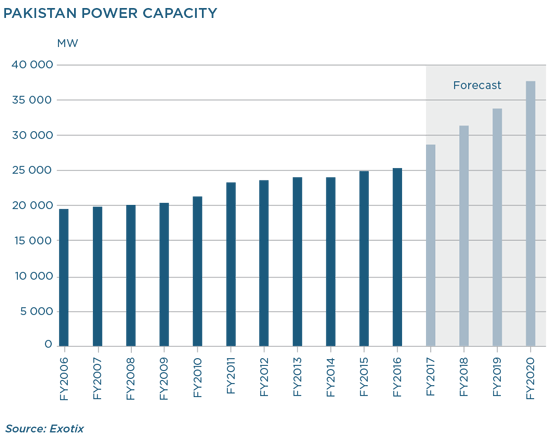
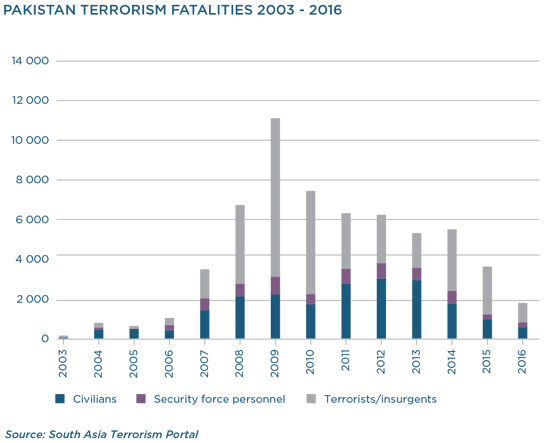
Pakistan has long suffered from insufficient energy supply and a lack of business and consumer confidence due to the ever-present threat of terrorism. The government has prioritised power generation, and a number of projects are due to come online over the next few years (see the following graph).
When we visited Karachi and Lahore in March 2014 there was a very real concern around the rule of law and civilian safety. This has changed dramatically since then, as can be seen in the following graph. Total fatalities fell 33% in 2015 and a further 51% in 2016. This has been the safest year in a decade and has resulted in a marked improvement in business sentiment and private consumption.
Another key driver to Pakistan’s performance in 2016 has been the excitement around the CPEC and the impact it is likely to have on corporate earnings over the medium term. The CPEC refers to an economic corridor stretching from Gwadar in southwest Pakistan to Kashgar in western China. The corridor includes $51 billion of power generation and infrastructure projects, mainly financed by the Chinese. The improvement in infrastructure will see broad-based benefits across the economy from the commercial port in Gwadar, improved road and rail networks, and power generation growth. This should see local banks enjoying a pick-up in private sector credit growth after a number of years of stagnation. The project construction phase should provide a boon to local cement manufacturers, with an estimated four million tonnes per annum needed – 10% to 15% of current industry demand. We are confident that our banking and cement holdings are well positioned to benefit from any incremental demand from the CPEC.
The final driver of Pakistani positivity is the announcement that MSCI will be upgrading the country to emerging market status. We typically place little value on MSCI’s arbitrary country classifications, but there are investors who do. The upgrade has the potential to see emerging market investors look to enter Pakistan, while some frontier investors will be forced to sell. The net impact is, however, likely to be positive and some investors are buying in the run-up to this.
We continue to be excited about the strategy and its underlying companies’ future prospects. We believe that the portfolio holds a number of attractively valued businesses across our frontier market universe. While Pakistan was the very bright star of 2016, we look forward to seeing which markets will deliver in 2017 and beyond.
Currency regimes have certainly been top of mind during 2016. Having flirted with the move to a free-floating currency, Nigeria ultimately opted to continue with a managed peg despite the dire consequences it has had on the economy. Egypt, on the other hand, has fully embraced a move to a floating-rate regime. This, coupled with the removal of subsidies and the $12.4 billion loan agreement with the International Monetary Fund, saw the economy completely reset and the country well positioned to put the past five years of hardship behind it. However, the short-term impact has been very negative for the strategy over the quarter. Egypt, which is still the strategy's largest country exposure, was down 24.4%, despite the market increasing by 54.4% in local currency terms over the past three months. Nigeria was down 5.3%, South Africa declined by 2.6% and Kenya declined by 2.5%. In contrast, there was strong demand for equities in Zimbabwe, partly due to the introduction of the new ‘bond notes’, which resulted in the Zimbabwean market being up 46% for the quarter. Against this backdrop, the strategy decreased by 4.6% during the quarter, compared to its benchmark (3 month USD Libor + 4%), which was up 1.2%, and the DJ Africa Titans 50 Index, down -2.3%.
As a whole, 2016 was a very difficult year for most of the major bourses across Africa, exacerbated by the weakness of African currencies against the US dollar. For the year, Nigeria was down 40.7%, Egypt declined 25.5% and Kenya lost 13.4%. The market in Morocco performed well over the calendar year, increasing by 27.4%, while the South African market increased by 15.9%. A strong performance over the last quarter helped the Zimbabwean market to gain 25.8% for the year. This saw the strategy end the year with a return of 4.3%, compared to a benchmark return of 4.8%. Over the same period, the Dow Jones Africa Titans 50 Index returned 17.1%.
Our investments in resource companies were the largest contributors to performance over the past year, the most meaningful of which were Anglo American (+3.3%), Centamin (+2.9%) and Impala Platinum (+2.1%). Largely due to the significant devaluations of both the Egyptian pound and the Nigerian naira during the year, the largest detractors to performance were Egyptian International Pharmaceuticals Company (-2.2%) and Stanbic IBTC (-2.0%).
Over the last five years, Egypt has been rocked by the Arab Spring protests, a soft coup, a collapse in oil prices and tourism all but disappearing on concerns around terrorism. We believe these events have resulted in corporate earnings for Egyptian companies being well below our estimate of normal. The Middle East’s most populous nation has also suffered from a history of regimes that sought to buy political goodwill through sizeable food and fuel subsidies, putting immense pressure on government finances.
The fiscal deficit has blown out to 12.3 % of GDP (2016E) and gross government debt levels have risen to 94.6% of GDP. This was not sustainable. Given the managed peg exchange rate regime, the burden on the central bank rose steadily over the course of the year as foreign currency reserves dwindled. Sourcing US dollars with which to import goods or equipment became increasingly difficult and a black market for US dollars emerged. The black market rate moved well above the official rate of 7.8 Egyptian pounds to the US dollar, eventually peaking at 18 Egyptian pounds to the US dollar in late October. The government was left with little choice but to float the currency.
Since its floating as of 3 November 2016, the Egyptian pound has lost over half its value and currently trades around EGP18/$. The impact of such an extreme currency move is that inflation has increased significantly, hitting 23.3% in December. The move has also meant that many economists believe the pound is now one of the cheapest currencies globally. The Egyptian economy has seen an almost overnight improvement in the competitiveness of its exports and affordability of its tourism industry.
While the float is certainly a step in the right direction, it was one of a number of economic reforms that have been passed as the Egyptian government looks to address the underlying problems in the economy. These reforms include removing fuel subsidies, increasing electricity prices, expanding the Suez Canal, improving power supply, the passing of the civil service law and implementing value-added tax. These changes, which have further added to inflationary pressures in the short term, will hugely benefit the country in the longer term.
The response from international investors has been immediate. In the month following the currency devaluation, the central bank recorded an estimated $4 billion in foreign capital inflows. Central bank reserves have swelled from $15.6 billion in October to $24.3 billion in December. A further $7 billion has flowed into the banking system as individuals have deposited their savings and remittances. As with any African economy, information is not always as accessible or transparent as one would like, but foreign equity flows into Egypt have been estimated at $500 million, with a further $1 billion in fixed income inflows over the last two months of 2016. We believe this is but the tip of the iceberg, with many emerging market and frontier funds once again starting to look at Egypt after a number of years out of the market. This return of foreign buyers partly explains the performance of the stock market.
While 2016 has been another tough year, we are encouraged by the step change we have seen in Egypt over the past two months. We believe that after a number of years of economic mismanagement and external pressures, the country is well positioned to return to growth once again. Looking across our portfolio, we are certainly excited to see what 2017 has in store for the excellent set of companies we own and for the strategy in general. We remain committed to finding high-quality businesses trading at attractive valuations, and then in holding them we will wait for share prices to reach our estimate of intrinsic value.
*All returns are quoted in US dollar terms unless otherwise stated.
Please click here for the Coronation Global Emerging Markets Equity and here for the Africa Frontiers strategies commentaries.