 South Africa - Institutional

GLOBAL HOUSEVIEW STRATEGY
2019 was a positive year, with the portfolio delivering double-digit returns and outperforming the benchmark. The major building blocks of the portfolio (global and domestic equity, and domestic bonds) performed strongly, with alpha in all of them further lifting returns. The portfolio has performed well against its peer group over meaningful time periods.
Global markets respond to stimulus
After a very weak fourth quarter of 2018, global equity markets rose strongly in 2019 in response to trade war fears receding, combined with looser monetary policy in the US and Europe. The MSCI All Country World Index returned an incredibly strong 26.6% in US dollars for the year and 9% in the fourth quarter of 2019 (Q4-19). All eyes remain on US President Donald Trump as he stands for re-election in 2020 and the reverberating effect his policy will have on Chinese- American tensions.
Elections in the UK saw a stronger-than-anticipated majority for the Conservative Party under Boris Johnson and moved the country closer to a withdrawal from the EU in January 2020. Emerging markets also performed strongly, up 18.4% for the year in US dollars and 11.8% in Q4-19. Notable performances included Russia (+53%), Brazil (+26%) and China (+24%). The portfolio’s exposure to emerging market equities benefited from strong market performance as well as some excellent stock picking.
The Bloomberg Barclays Global Aggregate Bond Index was up 6.8% in US dollars for the year and 0.5% in Q4-19. We remain cautious on global bonds given the very low yields at which they currently trade, high levels of government indebtedness and the risk of rising inflation.
Systemic woes remain a drag
In South Africa, the All Bond Index returned 1.7% for Q4-19, bringing annual performance to 10.3%. This compares favourably to other domestic asset classes.
South African investor confidence remains weak, as impatience has set in with the slow pace of much-needed reform. State-owned enterprises are fragile, with South African Airways entering business rescue in Q4-19 and the Passenger Rail Agency of South Africa placed under administration. The rebuilding of critical institutions is under way, with strengthened teams in place at the South African Revenue Service and the National Prosecuting Authority, and, most recently, the appointment of a new CEO at Eskom. The plight of Eskom remains concerning, as years of poor maintenance have resulted in an unstable power utility. Unplanned outages are very disruptive given the lack of spare capacity, and pose a major threat to economic growth prospects. The severe loadshedding experienced in December is expected to have taken a toll on retailers’ Q4-19 earnings. Growth continued to disappoint, with a contraction in both the first and third quarters of 2019. Low domestic growth and low inflation (3.7% CPI for 2019) should lead to rate cuts.
However, the South African Reserve Bank was reluctant to cut rates, believing that dovish monetary policy would have a limited impact given the high structural impediments to growth. As a result, real yields of South African bonds are at very attractive levels and local bonds therefore have a meaningful role to play in the portfolio. We are more cautious on domestic property, where we expect companies to struggle to show distribution growth over the medium term, as rentals that have benefited from high escalations for many years come up for renewal and are rebased to market.
The FTSE/JSE All Share Index (ALSI) returned 12% for the year and 4.6% for Q4-19. While this was a better year for South African equities, longer-term returns for domestic growth asset classes remain low (ALSI 6% p.a. and JSE Listed Property 1.2% p.a. over a five-year period). The JSE’s returns were boosted by the local resource sector, which performed strongly, overcoming fluctuating sentiment on global growth to finish the year up 28.5%. Industrials and financials were considerably weaker, delivering 8.9% and 0.6% respectively, with the higher domestic exposure of the financial sector weighing on performance. We continue to see value in South African-listed equities.
Within the Index, it was pleasing to see names that had detracted from performance in 2018 contributing strongly in 2019. Most notable among these were the platinum group metals (PGMs), with the portfolio’s holdings in Northam (+183% for the year and +47% for Q4-19) and Impala (+291% for the year and +51% for Q4-19) up particularly strongly. Other notable performers for the year include our global holdings with Quilter (+39%), British American Tobacco (+36%), Naspers (+23%) and Anheuser-Busch InBev (25%) also doing well. The portfolio’s underweight position in domestic businesses contributed positively, as the challenges of a lacklustre consumer environment and persistent structural cost inflation eroded earnings.
Portfolio activity
While our equity and balanced portfolios remain significantly exposed to offshore stocks, we have added to selected domestic holdings where we see value. Any near-term recovery in domestic stocks is likely to reflect a shift in sentiment rather than a dramatic improvement in earnings.
On the resources front, our large exposure to the PGM sector contributed meaningfully to portfolio performance for both the quarter and the full year. Platinum-group companies benefited from rising prices given growing demand (as emissions regulation requires higher vehicle PGM loadings) and a limited supply response. While we have cut our holdings into price strength, we still have meaningful exposure. Years of underinvestment in PGM mines mean that supply is unable to respond timeously. Significant capex with long lead times is required to change this.
Northam’s strength also reflected an easing of investor concerns on the overhang of the broad-based black economic empowerment (B-BBEE) deal funding, which becomes less dilutive at a higher share price. Another meaningful contribution came from the portfolio’s large position in Anglo American, which benefited from its ownership of Amplats (+149%) and Kumba Iron Ore (+65%). Both assets benefited from commodity price strength due to tight markets with an inability for supply response in the short term. We anticipate that the PGM deficit will be more enduring.
Sasol suffered a tumultuous year, collapsing on the back of further cost overruns relating to the Lake Charles Chemicals Project and a delay in its financial results. The board used this time to conduct a thorough review of internal controls and governance structures. Our underweight position during the year contributed to performance and we took the opportunity to add to the position at a time when investors had lost faith in the company. The previous joint-CEOs have now left the business and a new internal appointment has been made.
Additionally, the ethane cracker achieved its optimal run rate by year-end. The share has rebounded c. 20% off its recent lows. Risks in the company remain high and we continue to manage the position size carefully.
Within the financial sector, Quilter performed strongly in its second year of listing as the market bought into management’s vision of building a focused, integrated UK wealth manager.
The reduced uncertainty in the UK political backdrop also helped. Naspers had a busy year with the unbundling of MultiChoice; the establishment of Prosus, an Amsterdam-listed entity that houses its international assets; the unbundling of a portion of Prosus (26%) to shareholders; and a bid for Just Eat, a multinational food delivery player. Unfortunately, the restructuring had little impact on the discount at which Naspers (and now Prosus) trade to their underlying holdings.
Given the capital allocation track record of management, we think the market is taking an overly pessimistic view on the discount. Due to the attractiveness of the underlying assets and the holding company discount, Naspers and Prosus constitute a significant holding in the portfolio.
Their major asset, Tencent, is growing rapidly in online payments and financial services, a market segment many times larger than the gaming market they currently dominate. While strong incumbents and the regulated nature of financial markets do increase the risk profile, the financial services offering has the potential to be a very large and profitable business.
British American Tobacco continued to deliver on its strategy, growing revenues (despite falling volumes in traditional combustible tobacco), widening margins (helped by cost reduction) and showing strong cash conversion, despite a changing regulatory environment. US regulators are becoming increasingly concerned over youth recruitment and the potential harm of alternative tobacco delivery methods like vaping. The magnitude of the threat posed by this category to its traditional business now looks reduced.
While it was pleasing to see market recognition of the value inherent in some of the portfolio’s larger positions during 2019, we continue to see attractive opportunities for disciplined, long-term investors that should generate inflation-beating returns over time.
GLOBAL EMERGING MARKETS
The Strategy returned +13.0% during Q4-19, which was 1.1% ahead of the +11.8% return of the benchmark MSCI Global Emerging Markets Total Return Index. In 2019, it returned 39.9%, which was 21.4% ahead of the market’s return of 18.4%. This performance made it the Strategy’s best relative year since its inception almost 12 years ago (the previous best relative year was 2013 when it outperformed the market by 19.4%) and its third best year from an absolute return point of view, behind 2009’s +90.9% and 2017’s +40.7%. It has now outperformed the market over one, three, five, seven and 10 years, and most importantly, is ahead of the market over long time periods, with outperformance of 2.8% p.a. over 10 years and 4.2% p.a. since inception 11.5 years ago.
All the right moves
There were several stocks in 2019 that contributed more than 1% each to this outperformance and only one that detracted by 1% or more. In terms of positive contributors, Wuliangye Yibin led the way (appreciating by 161% and contributing 3.6% to performance), followed by New Oriental Education (+121%, +2.5% contribution), JD.com (+67%, +1.3% contribution), Yduqs/Estácio (+95%, +1.2% contribution), Yandex (+59%, +1.2% contribution), Adidas (+58%, +1.1% contribution) and Li Ning (+194%, +1.0% contribution). The good performance in 2019 was partly a reversal of a poor 2018 – three of the five worst performers in 2018 (JD.com, British American Tobacco and Cogna/Kroton) were all top 15 positive contributors in 2019, but it was also aided by a number of long-held positions coming through, including Yduqs/Estácio and Adidas referred to above. In addition, the likes of Airbus (+54%) and Sberbank (+59%) also contributed meaningfully.
Lastly, a number of more recent (calendar 2018) buys also played a large role, including Wuliangye, New Oriental and Li Ning. Of the seven largest positive contributors in 2019, we have totally sold out of one (Li Ning) as it reached our fair value, and we have materially reduced the position size of a few counters, including New Oriental (a 2.5% position in September 2019 to a 1.3% position December 2019) and Adidas (1.4% position September 2019 to a 1.0% position December 2019). In terms of negative detractors, it was only Taiwan Semiconductor (TSMC) that detracted by more than 1% (-1.1% impact). The Strategy did own TSMC, but the position size was smaller than that of the Index, and TSMC was a strong performer in 2019 (+62%).
Building exposure
There were four small new buys in the Strategy during the quarter (all 1% or smaller positions) and five sells to zero. In terms of new buys, we initiated positions in Tencent Music Entertainment (TME, 1% position), LG Household & Healthcare (LG H&H, 0.8% position), Midea and CP ALL (both 0.5% positions). In terms of sells, the Strategy fully sold out of Li Ning and China Resources Beer (+194% and +59%, respectively) during 2019, with both reaching and exceeding our estimates of their fair values. It also sold out of its remaining small positions in BB Seguridade after it reached fair value and Porsche, on the back of concerns about the long-term future of the traditional automobile industry. Lastly, it sold out of Cognizant, largely due to switching into its higher quality competitor Tata Consultancy Services, which was already a Strategy holding.
In terms of geographic exposure over the quarter, the only meaningful change was the reduction in the Strategy’s developed markets exposure (companies with at least 40% of revenue, profits or value coming from emerging markets), which went from 21.3% to 18.4% due to the sale of the Porsche position, as well as a reduction in the Adidas position. This 18.4% current exposure is largely in line with Strategy’s average developed market exposure of 17.8% in the Strategy since inception just under 12 years ago and well below the Strategy’s cap of 25% developed market company exposure. China remains the largest country exposure in the Strategy (32.3% but effectively 37% if the look-through Tencent exposure in Naspers/Prosus is included), followed by India (10.2%) and Russia (9.3%).
Tencent Music Entertainment
TME is 58% owned by Tencent and has two main businesses: a) it is the leader in online music in China, with around 75% of market share; and b) it has a large online social entertainment business, which focuses on music-related live streaming and online karaoke. The online music streaming business is the better of the two in our view and is essentially the Chinese Spotify, which actually owns an 8.6% stake in TME. TME have c. 650 million online music users in China (as a reference point, Spotify globally has a total of around 250 million users), but both the proportion of users who pay anything and the average revenue per user of those who do are low, and should increase over time and drive the top-line.
Today the business makes a small loss at the operating level, but with continued revenue growth and the resultant leverage of the cost base, in our view, it will be very profitable in years ahead. Content costs are cheaper in China than elsewhere globally (partly due to a fragmented music industry) and this should result in higher operating margins than the likes of Spotify, for example, are likely to achieve.
Currently, the online music business contributes c. 30% of TME’s revenue (and no profit) by our estimates, but over time we forecast that it will contribute c. 45% of TME’s revenue and c. 35% of its profits. The online social entertainment business (70% of TME’s revenue today and 100% of profit) is a very profitable business (earnings before interest and tax margins of c. 25%), but operates in a far more competitive area of the market where the barriers to entry are lower.
We still expect this business to do well going forward, but the jewel in the crown and the main driver will be the online music business, in our view. TME went public just over a year ago at $13 a share and we didn’t participate in the initial public offering (IPO) at the time. The Strategy has only ever participated in one IPO (JD.com) in its 11.5-year history as IPOs are almost always priced very favourably for the seller. After completing our due diligence on TME and gaining conviction, with the share price doing little since the IPO, we built the Strategy’s position one year later in December 2019 at an average price below $12. At the time of purchase, TME was trading on around 25 times forward earnings (c. 20 times forward price to free cash flow as the business converts c. 125% of earnings into free cash flow), which we believe is an attractive entry point for this asset.
LG Household & Healthcare
LG H&H is a South Korean-branded consumer company with c. 75% of profits coming from cosmetics and the other 25% from household personal care goods (similar to Unilever) and beverages (including the Coca-Cola rights in South Korea). The cosmetic business is the key driver and is what interests us most. The worldwide cosmetics industry has grown in excess of global GDP over the past decade (LG H&H has grown at between two and three times the industry), is economically resilient and is a prime beneficiary of the wealth effect and rising disposable incomes. This is particularly the case with the Chinese consumer and in this regard LG H&H is very well placed – today over half its sales come from the Chinese consumer (c. 15% in China itself and the balance from Chinese shopping, largely at duty-free stores in South Korea). LG H&H has been investing heavily in its main brand ‘Whoo’ for the past decade, as it has been particularly popular among Chinese consumers. This is both a continued opportunity and a threat going forward. Over the past decade, LG H&H has grown revenue at 13% p.a. and earnings per share at 18% p.a., and today, the business generates a return of earnings (ROE) of c. 20%. The Strategy purchased LG H&H on c. 22 times forward earnings, which we believe is attractive for this high-quality asset.
Midea
This leading Chinese household appliances manufacturer has a 34% market share in washing machines in China, 24% in air conditioners and 15% in fridges. The company is vertically integrated (R&D, manufacturing, sales, warehousing and delivery) and is expanding into and developing logistics and robotics capabilities, as we increasingly move towards a smart technology world. While China (58% of sales) is its biggest market by far, it also generates revenue by selling in 200 other countries. Over the past five years, 110% of earnings have been converted into free cash flow and the business generates an ROE of c. 25%. In our view, the share is attractively valued today, trading on c. 14 times forward earnings with a 3% dividend yield.
CP ALL
CP ALL is the third largest 7-11 (convenience store) operator in the world (behind Japan and the US) with 11 500 convenience stores in Thailand (c. 80% of group profits) as well as over 100 cash and carry stores (Makro generates 20% of group profits). The business continues to roll-out c. 700 new 7-11 stores a year in Thailand, as well as increase the contribution from higher margin categories such as coffee, ready-to-eat meals and banking services within its stores. As a result, our view is that the business can continue to grow at a low double-digit rate in the years ahead.
In addition to its core Thailand business, it has nascent cash and carry operations in Cambodia, Myanmar, India and China, and is in discussions for the 7-11 Master Licence in Cambodia and Laos. Once a market darling, the share has been flat for the past two years and recent concerns about a potential bid for Tesco’s business in Thailand brought it into buying range.
Year-end composition
At the end of December 2019, the weighted average upside to fair value for the Strategy was around 30%. This is lower than the approximately 50% historical average; however, this is not abnormal after a period of strong absolute performance and we believe the absolute upside is still quite compelling. This is especially so when one considers that the quality of the companies owned in the Strategy is above average when compared to history.
FRONTIER MARKETS
Frontier markets are certainly no favourite. It is easy to see why, with the S&P 500 continuing to fire on all cylinders, delivering +31.5% in 2019 alone. Investors venturing beyond safe havens have not been rewarded. Outflows and fund closures, mainly in the Africa space, continue to impact the industry, with several funds winding down over the course of the year.
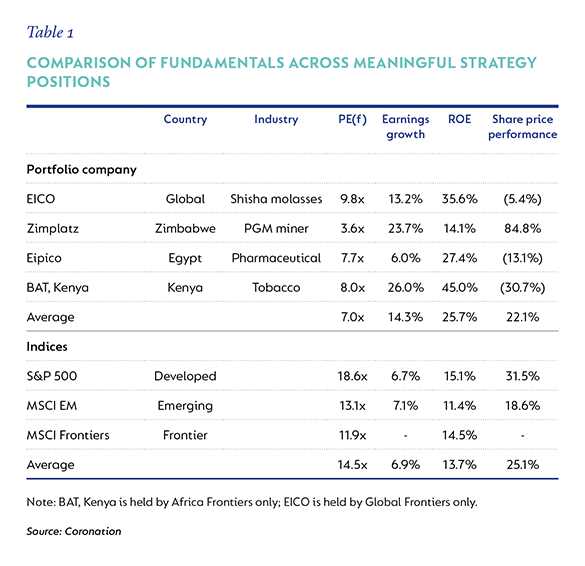
In this environment it is easy to forget that the shares in the portfolio are not simply numbers on a screen, but ownership stakes in actual companies. Have fundamentals changed? For many of the companies in our portfolio, the answer is: not much. They continue to grow, generating free cash flow and paying healthy dividends. Offering some insight, Table 1 below compares the fundamentals of some of the more meaningful positions in our frontier strategies to developed, emerging and frontier market indices.
It shows that the investee companies:
- Trade at forward price-to-earnings multiples well below broader indices;
- Have grown in line to well ahead of the indices;
- Have generated higher returns on equity than the indices; and
- Bar Zimplats, 2019 share price performance is vastly removed from the earnings growth and return on equity (ROE) performance of EICO, Egyptian International Pharmaceutical Industries Co. (EIPICO) and British American Tobacco (BAT) Kenya.
With respect to Zimplats, the share price has increased significantly from a very low base; however, the company still trades on less than four times earnings.
All these businesses enjoy strong fundamentals, healthy growth prospects and incredibly attractive valuations, especially relative to some of the indices above. This is a rough measure, but when drilling into the portfolio that you hold, it quickly becomes apparent that it has been a year in which equity prices have declined or under-performed underlying company performance, and the upside to fair value for the portfolios has never looked this attractive.
Detractors
The main detractors and reasons for under-performance in 2019 can be grouped into the following categories:
Zimbabwe write-down (attribution: Global Frontiers -3.2%; Africa Frontiers -6.4%)
We have written at length about the decision and rationale to write down our Zimbabwe exposure. Despite the impact being incredibly painful and the main driver of this year’s poor returns, we continue to believe that the decision was prudent and protects investors in the Strategy. Any improvement in the transactability of the country should see strong improvements in our realisable values and performance. Unfortunately, as at year-end, an improvement has yet to be seen.
Index concentration (attribution: Global Frontiers -5.4%; Africa Frontiers -5.2%)
With respect to Global Frontiers markets, the MSCI Frontier Markets Index is dominated by Kuwait, which makes up 30% of the Index, and to which the Strategy has no exposure. Kuwait had a strong year in 2019 and returned 28.6%. This was a result of the MSCI announcing that Kuwait will be upgraded to emerging market status in 2020. Kuwait was the most significant driver of Index returns in 2019, accounting for c. 50% of its total return.
In the African Frontiers context, the FTSE/JSE All Africa ex-South Africa 30 is dominated by the Egyptian bank CIB, which makes up 17% of the Index. CIB had a strong year in 2019, returned 59% in US dollars and accounted for c. 60% of the Index’s total return. The Strategy had exposure to QNBA, an Egyptian bank exposed to the same underlying drivers as CIB. QNBA trades at a 50% discount to CIB, despite delivering stronger earnings growth. QNBA is not in the Index and thus less widely owned than CIB. Over the year, QNBA returned 35% in US dollars and was one of the Strategy’s largest contributors (+2.2% contribution). However, the smaller position size and lower return relative to CIB still meant that CIB hurt our relative performance.
While relative performance to these indices, which we feel do not adequately reflect our investment universe, is not something we typically focus or comment on; given the outsized impact this year, it is worth understanding.
Divergence between valuations and fundamentals (attribution: Global Frontiers -2.7%; Africa Frontiers 3.0%)
In both strategies, several of our holdings have had very good years, reporting strong earnings growth and improved fundamentals. Unfortunately, share prices have largely ignored this and often declined significantly. BAT, Kenya (-1.2% contribution) is a prime example of this. Earnings were up 26% as at the end of the first half of 2019, and with the second half up against a flat base, the full-year numbers should be similarly healthy. Despite this, the share price fell c. 30% in US dollars and it now trades on an 8.9 times historic price earnings multiple and comes with a 9.0% dividend yield. Stanbic IBTC detracted (contribution Global -0.4%, Africa -0.7%) as the share fell 15% and EIPICO (-0.2% contribution, with the share down 13%). In the Global Frontiers Strategy, EICO detracted -0.9%, with the share down 6%.
This divergence between earnings growth or underlying business fundamentals and share prices is seldom cause for concern to the long-term investor. Over time, business fundamentals are what matter and a growing earnings stream in US dollars will result in share price growth. The key is to be patient enough to wait for this to happen.
In both Strategies, the largest contributor was Zimplats (+4.1% in Africa Frontiers; +2.4% in Global Frontiers), which had a very good year on the back of an increase in platinum group metal prices.
Global Frontiers Strategy
The past year has been a particularly challenging one for the Strategy, which increased 1.8% over the course of the year, underperforming the MSCI Frontier Markets Index, which was up 18.0%. The year saw vastly divergent returns across the global frontiers universe, with equity markets in Kuwait (+28.6%), Egypt (+19.5%), and Kenya (+19.1%) all incredibly strong. Conversely Bangladesh (-18.4%), Nigeria (-14.9%) and Argentina (-13.5%) experienced a year to forget. Despite an incredibly disappointing 2019, the Strategy’s five-year and since-inception (1 December 2018) gross annualised returns of +2.8% p.a. and +3.0% p.a., respectively, are ahead of the Index’s respective returns of +2.7% and +1.8%.
While these returns are well below our expectations, the Strategy is young, and we are very positive about its future.
Africa Frontiers Strategy
Our Africa Frontiers Strategy also experienced a particularly challenging year and declined by 5.6%. As a result, the Strategy underperformed the FTSE/JSE All Africa ex-South Africa 30 Index, which was up 16.5%. The Index was driven by strong returns in Egypt (+19.5%) and Kenya (+19.1%), with Morocco (+6.9%) and Nigeria (-14.9%) less impressive. Returns in Egypt were largely driven by strength in the Egyptian pound, while Kenya ended the year with a bang, rallying +17.2% in Q4-19, on the back of the interest rate cap repeal. Despite an incredibly disappointing 2019, the 10-year and since-inception gross annualised returns remain healthy, at +6.0% p.a. and +7.7% p.a., respectively. Despite 2019 being a torrid year, we have strongly outperformed the Index, which has returned +3.0% over 10 years and -0.3% since the Strategy’s inception on 1 October 2009.
The past quarter has shown improved absolute performance, with the fund up 6.3%. The FTSE/JSE All Africa ex South Africa 30 Index was up 7.6%. During the quarter, we added to Nigerian Breweries and IDH, while selling out of Cleopatra Hospitals and trimming our Safaricom position due to valuation concerns.
Outlook positive
With the challenges of 2019 front of mind, we are not underestimating the headwinds that might come our way in 2020. However, the one thing we have learnt is that the odds are weighted in the investor’s favour when you start the year with deeply discounted valuations for companies that are growing earnings strongly. We invest in thin markets, and capital flows exaggerate returns. 2020 certainly has the potential for a significant rerating, should there be any new flows to the asset class. Consequently, we are very excited about the year ahead. With the valuations of several high-quality businesses having reduced meaningfully over the past year, future returns should be healthy.


Explore Investment Insights on the global economy, markets and topics related to our business.
Subscribe to our Corospondent newsletter