 South Africa - Institutional

Economic views
SA’s water supply crisis: system failure and a Constitutional conundrum
“All the water that will ever be is, right now.” – National Geographic
The Quick Take
- SA’s water system is challenged straight through - from source to tap
- Access to clean water is enshrined as a human right in SA’s Constitution; which also outlines how it is to be delivered, and by who
- Overregulation has resulted in a lack of accountability; but DWS is getting its house in order after years of State capture
- The rump of the problem lies with debt-ridden municipalities

With all eyes on South Africa (SA)’s power crisis, until recently, memories of Cape Town’s 2018 race toward ‘Day Zero’ had receded. But this has changed, and recent reports show that SA’s water supply is in dire straits and demands urgent attention.
It is a complex situation. Not only is SA a water-scarce country, but the supply chain from source to tap is complex. It comprises many integrated systems, and the regulatory framework that governs their operation as well as their oversight is complicated and problematic.
Simplifying the issues into three parts helps to shed light on the critical issues.
- Water supply – SA’s natural endowment and how this is reticulated falls under the Department of Water and Sanitation (DWS).
- The regulatory environment – SA’s legislative framework and what it means for water supply and delivery.
- Managing water quality and getting it into a tap – Which largely has to do with local government and is the weakest link in the water system, with the majority of municipalities failing miserably to meet their obligations.
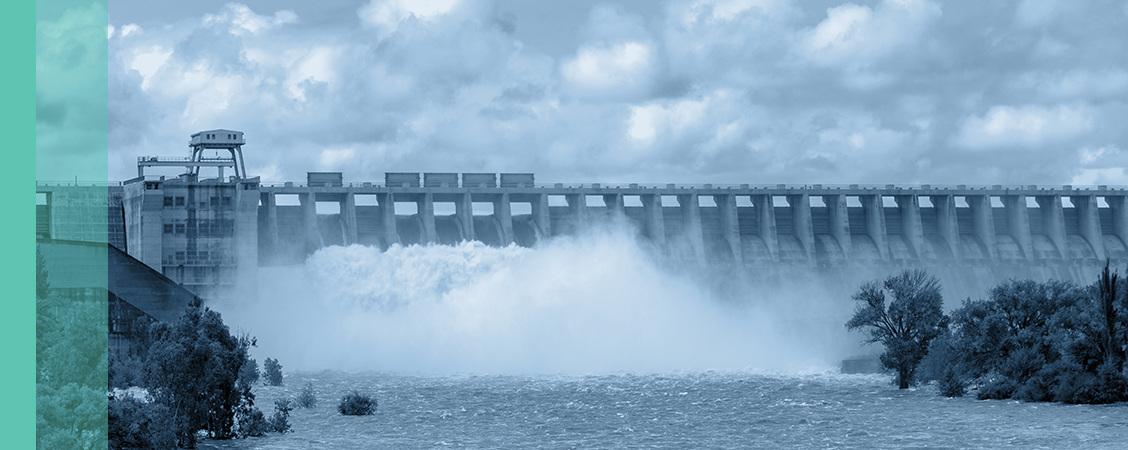
WHERE DOES OUR WATER COME FROM?
SA’s average annual rainfall of around 460 millimeters (mm) is just over half the global average of 860mm. Only 9% of SA’s rainfall flows into rivers, lakes, and dams, while 4% replenishes groundwater reserves. Compounding this scarcity is that rainfall is unevenly distributed across the country, being highly concentrated in 20 water source areas located in the more mountainous eastern and southern regions; 21% of the country receives less than 200mm annually.
To highlight the degree of concentration, consider that the rain that falls on just 8% of SA’s surface area contributes to 50% of runoff, and can be abstracted for use in irrigation, industry, consumption, and sanitation. The total mean annual runoff that ends up in SA’s rivers is 49.2 billion cubic meters (bcm)*, of which 4.8bcm derives from Lesotho and 0.7bcm from Swaziland.
Water legislation requires a proportion of water to remain in the system, the so-called ‘ecological reserve’, to ensure water systems are sustainable. This means only 13.2bcm of the 49bcm annual capacity is available for use, of which we have been using 92% (c.12.1bcm) since 1998.
SA also has no commercially navigable rivers, and most of our natural waterways are small and seasonal and are primarily used for farming. The larger rivers – the Orange, the Vaal, and parts of the Limpopo – run through areas of the country where there is little industry, while SA’s commercial and industrial heartland – Gauteng – has no sustaining water source. This key province is 100% reliant on water from the Integrated Vaal River System, which comprises 14 dams in Mpumalanga, KwaZulu-Natal (KZN), the Free State and Lesotho. All said, seven out of nine provinces rely on water from other provinces for around 60% of their economic activity.
To provide water to these provinces, SA is divided by regulation into 19 water management areas (WMAs), which oversee the transfer from more abundant water catchment areas to less abundant ones. These ‘inter-basin transfers (IBT)’, are the lifeblood of the domestic economy. They enable the damming of river water in a total of 5 569 dams, of which there are 320 major dams storing 32bcm of water (c.65% of mean annual runoff that flows into rivers). From these dams, SA’s complex hydraulic systems move water into the interior. This method impacts the sustainability of the water while relying on complex infrastructure, both of which need long-term planning and maintenance.
AN OUTLIER
The Western Cape deserves a special mention because the region is hydrologically divided from the rest of the country by the Karoo and it has its own water system, which relies largely on the rainfall runoff into six large dams. While water is a national resource, the Western Cape owns part of the Berg River Dam (through the Trans-Caledon Tunnel Authority), and the City of Cape Town is largely responsible for the ‘source to tap’ system – so it has a lot of influence over the supply chain.
Cape Town materially reduced water use during the critical period of the ‘Day Zero’ countdown during the drought in 2018, but demand has since largely recovered (although not back to pre-drought levels). Following the drought, the Western Cape Government formulated the Cape Town Water Strategy, which was legislated in 2019. The Strategy aims to develop an additional 300 million litres per day of water-supply capacity by 2030 to help secure the city’s ability to be water resilient. Measures include improving dam capacity and drawing on alternative water sources, including desalination and improving water reuse. However, delays in implementing the Strategy have left it vulnerable to changes in weather patterns and strong growth in water demand.
THE ‘WATER-ENERGY NEXUS’
Water and energy are also inextricably linked in what is known as the ‘water-energy nexus’, which is very much part of this overall system. Not only does moving water generate energy that can be harnessed, but moving water uphill requires energy. This relationship has developed over time in SA and has its origins in the need to build infrastructure for the mining communities in the interior of the country dating back to the 1800s. As mining expanded and the communities and industries which accompanied it did too, the need for larger and more sophisticated water reticulation systems increased.
The discovery of coal led to an extended period during which Government funded a complex set of dams, transfers, pump stations, and water transfer schemes that were a critical part of the ultimate development of Eskom. In turn, Eskom developed technology that could utilise energy provided by water and, together the interplay between these systems, enabled the economic development of the country.
These systems and infrastructure are aging, and the processes that are necessary to sustain and maintain them are at risk. Water monitoring and measurement at source has seen three decades of reduced fiscal and human resources (people are needed to monitor rainfall, river flow, and ground water at source regularly, over long periods of time); and most of the larger rivers are dammed to capacity. Maintenance and investment into the engineering of these aging systems (some date back to the post-Anglo Boer War period) has been poor. That said, this part of the system is in ‘relatively’ good shape.
THE REGULATORY ENVIRONMENT CREATES ITS OWN CHALLENGES
In 1994, the new government made material changes to the regulations governing water. Firstly, water was nationalised, replacing riparian rights with licenses for water use. Secondly, the government was one of the first in the world to allocate water specifically for use by the environment to ensure the sustainability of the resources on which we depend. This water is the ‘ecological reserve’ mentioned earlier. Lastly, Section 2 of the Constitution guarantees everyone’s right to access sufficient water and places legislative and other measures on the State in progressively realising this obligation.
The Constitution also confers different obligations to local, provincial, and national government in the management of water:
- National government has legislative and executive authority over all freshwater resources.
- Local government is meant to structure and manage all aspects of providing water services, including administrative, budgeting, and planning.
- Within this, municipalities must administer water and sanitation services, including water supply, domestic wastewater, and sewage disposal systems in addition to ensuring quality potable water is delivered to residents.
There are two umbrella Acts that govern water:
- The National Water Act (36 of 1998) governs water as a resource and confers obligations and rights on the DWS and the Minister in charge.
- The Water Services Act (103 of 1997) regulates access to and delivery of water as a service.
At its core, the Water Services Act aims to deliver on the constitutional obligations of providing access to basic water supply and sanitation necessary as a basic human right. This mostly falls to local government (with some oversight from the Department of Cooperative Governance and Traditional Affairs [CoGTA]). There are also two Acts that govern municipal structures and systems, which are important because they confer certain obligations to municipalities.
The problem is that this web of regulations creates a host of issues for accountability:
- Water use licenses issued by DWS have never worked efficiently. Licensing is complex and slow, which discourages investment because access to water over time is not guaranteed. The DWS has been poor at managing this process.
- Water Boards are tasked with selling bulk water to Water Service Authorities to treat and provide to end users. Only four of SA’s nine Water Boards have achieved >80% of their performance targets in 2021/2022 and only one received a clean audit, according to the Auditor General.
- The Constitution prevents one Ministry from interfering with another. DWS and CoGTA can only ‘cooperate’. The DWS cannot make CoGTA ensure that local entities deliver water to residents.
- South Africa is more federal than we think. Local governments are in control of everything between the Water Boards and households, corporates, developments and settlements, via taps, pipes and treatment facilities. These administrators generally have a poor track record.
- Local government intervention in the case of operational failure can only ever be temporary. National departments can place local entities under conservatorship for a maximum period of six months. After that, the oversight is returned to the local authority, limiting progress in improving service delivery.
None of these issues are easily addressable, and so the DWS and other entities are being forced to find ‘work around’ strategies, which take time and have, to date, had limited success.
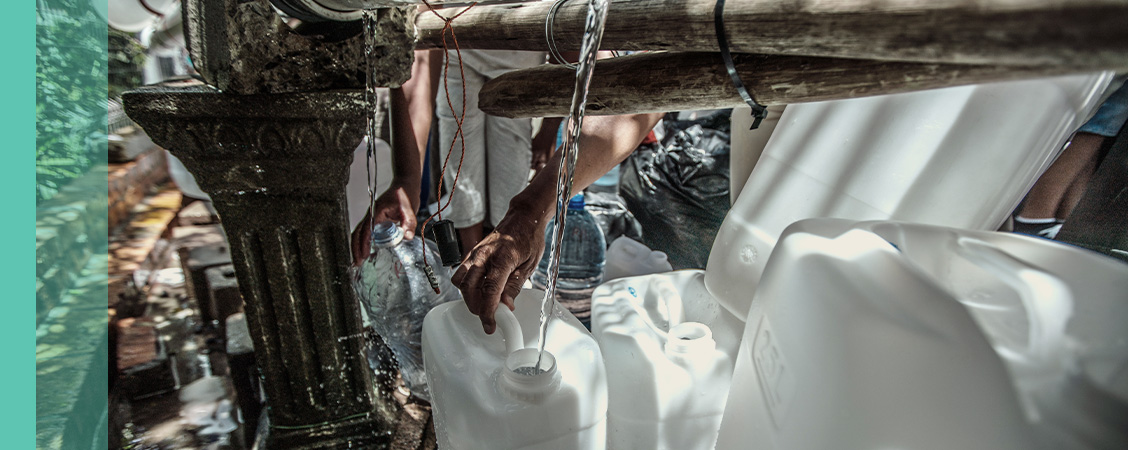
MANAGING WATER QUALITY AND GETTING IT INTO A TAP
The very weakest part of these complex systems is right at the end of the supply chain and has a lot to do with local government. Population growth, coupled with water scarcity and climate change, has increased strain on water resources and infrastructure, but this has been materially exacerbated by the poor performance of the entities tasked with maintaining water and sanitation infrastructure and systems.
The supply chain here can be divided into two parts, but both are the responsibility of local government. The best analytical framework comes from the Green Drop National Report and Blue Drop Progress Reports 2022 published by DWS. The Green Drop Report measures wastewater quality and the Blue Drop Report measures drinking water quality, both using weighted formulae of relevant criteria (including infrastructure, oversight, maintenance, etc.), but microbiological and chemical compliance of the water quality carries the biggest weight. Green or blue drop ‘status’ is awarded to those that qualify out of the 144 participating authorities (mostly municipalities).
While these surveys are well-designed and focus on critical aspects of the system, the problem is that they carry no enforceable application; any improvements or interventions happen at the behest of the municipality/local government implicated (sort of a ‘name and shame’ process).
The improving trend of green drop certifications from 2009 - 2013 suggests that the initiative had a decent success rate in prompting action by entities that failed to achieve green drop status in the previous period. But the decline from 60 green drop certifications to just 22 between 2013 and 2021 is very worrying.
Of SA’s 850 local government wastewater treatment works (WWTWs):
- only 24% (201) complied with required effluence standards, and
- 76% of WWTW water quality was below required specifications.
This sub-par water often flows into rivers and the sea. As a result, we are seeing an increase in related illness. To make matter worse, some of this is tapped (stolen) and used in informal agriculture, feeding pollution into the food chain.
The 2021 Blue Drop Risk Rating found that:
- 40% of supply systems achieved microbiological compliance, and 23% achieved chemical compliance.
- Only 34% of supply systems have sufficient microbiological samples based on population size to comply with the South African National Standard 241:2015.
- 83% of systems have <80% chemical compliance monitoring, indicating both insufficient sampling and/or insufficient chemical determinand testing.
CAPACITY ISSUES
An important part of this problem is municipal capacity. Also, there is no/limited devolution between water services authorities and water service providers – the last two links in the chain to provide potable water to users. So, weak municipalities = weak water services. There’s no reason why these can’t be separate entities.
In addition to water quality, potable water quantity is under pressure from what’s called ’non-revenue water’, which is treated water lost through leaks and commercial (illegal connections) losses. DWS estimates that 30% - 40% of treated water is lost this way, with an estimated cost of R8 billion per annum. Losses in the Western Cape are lower, cited loss in Gauteng is 40% - 45%, and even higher in KZN.
Put differently, most water service authorities cannot account for at least this amount of the treated water they produce or buy. This adds materially to the financial instability of water-related services, as only half of the purchased, treated water can be charged for (after the free basic allocation is made). The hard fact is that most water loss is due to poorly maintained infrastructure, and yet very little effort is made to curb these losses.
IN CONCLUSION
The water system is highly integrated and under pressure throughout. The ‘national’ part of the water supply chain is in better condition than the ‘local’, but that’s not saying much. The regulatory framework reinforces inefficiencies and undermines oversight and accountability. We need to think strategically about how to mitigate water supply risk and address some of the system failures. Unless we do so, the critical link between water access, human welfare and dignity and investment (growth) will continue to weaken. We already have signs of both.
* 1 trillion litres


Explore Investment Insights on the global economy, markets and topics related to our business.
Subscribe to our Corospondent newsletter