IN LAST QUARTER’S commentary we wrote, “2019 was a year to make money”. However, we also cautioned that, “after a sustained period of strong equity returns, declining interest rates, reduced tax rates, expanding profit margins and rising valuation multiples, investors should recalibrate their return expectations lower. The conditions in place today are quite different to those in place a decade ago. We have no insight into short-term market moves but feel that absolute returns could very well be lower over the next 10 years compared to the last 10”.
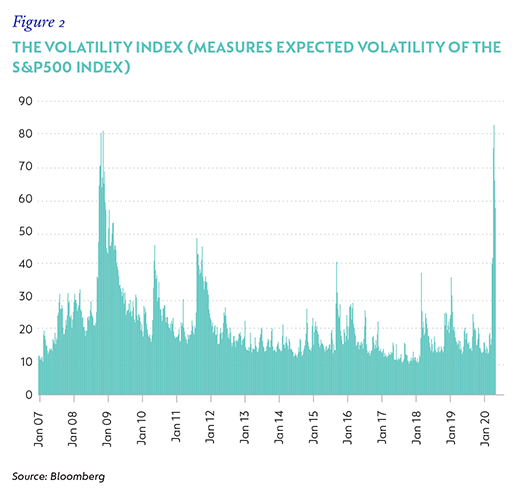
Well, we didn’t have to wait long. Risk assets plunged over the first quarter of 2020 (Q1-20) as the economic consequences of the Covid-19 pandemic started to become apparent. Economic activity in many countries and sectors around the world has ground to a halt. This unprecedented ‘full stop’ caused stress and market dislocations across the spectrum. Volatility was back with a vengeance, and in both credit and equity markets, indicators spiked to levels above those seen during the Global Financial Crisis (refer to figures 1 and 2)


With this as a backdrop, the Strategy returned -16.1% for the quarter compared to -13.3% from the benchmark. While the Strategy’s equity holdings were marginally behind the benchmark, the underperformance was caused by its non-equity holdings. Here, the Strategy’s lack of developed market government bond exposure was the primary culprit, as we had chosen instead to take some credit risk, which sold off as credit spreads increased. Importantly, these are mark-to-market losses, not permanent impairments, as we either still hold those securities or have rotated into issues with a more favourable risk-reward profile. Although we are never satisfied with underperformance, it should be considered in the context of:
- a very strong 2019 return of 25%, which was 6.4% ahead of the benchmark;
- long-term returns that remain satisfactory (5.9%% p.a. over 10 years versus the benchmark return of 5.1%, which translates into a real return of 4% to 5%); and
- a much-improved opportunity set, which is most important for potential future returns.
DRIVERS OF STRATEGY MANAGEMENT
Following such a dramatic quarter, it is also worth reflecting on the additional aims for managing the Strategy, as outlined in last quarter’s commentary:
- Deliver attractive absolute returns (meaning-fully ahead of inflation) After meaningful declines, expected long-term returns for both corporate credit and equity markets are now higher. In the short to medium term, however, the potential range of outcomes is much wider. Investors should not be surprised to see more volatility, to both the upside and the downside.
- Offer some downside protection from equity market volatility (though with equities as a core building block, investors in the Strategy should not expect to be fully shielded from market sell-offs) Compared to equity markets, the Strategy delivered 94% of its positive return in 2019, while in Q1-20 it has delivered 75% of the negative return. In other words, the Strategy participated in almost all of 2019’s upside, but only in three quarters of the recent downside.
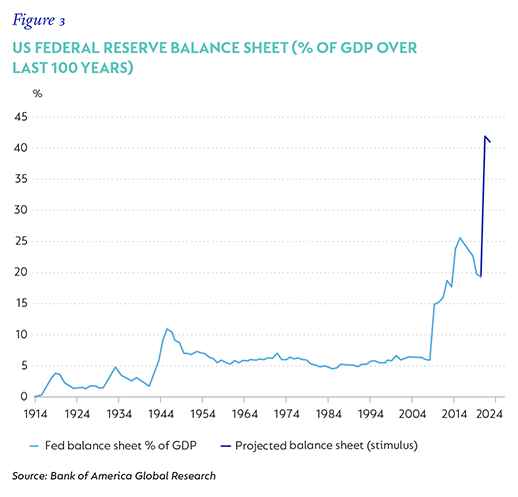
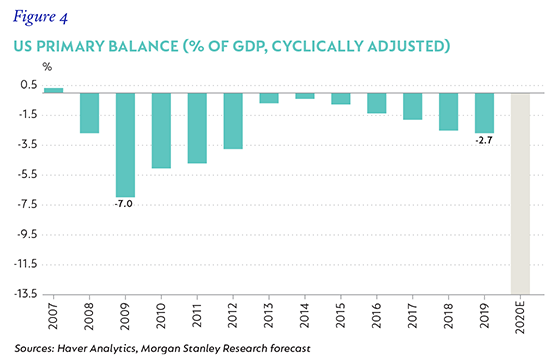
- Do not expose the Strategy to excessive risk, even if such exposures are large in the benchmark (such as developed market government bonds today) The fiscal and monetary response is unprecedented. Aggressive monetary measures are pumping vast amounts of liquidity into the system, causing central bank balance sheets to surge, while fiscal deficits are also set to explode once economic support is factored into government finances.
Data for the US is shown in figures 3 and 4, but it is mirrored (to varying degrees) in Europe, Japan, China and the UK.


EVENTUALLY, THE WORLD WILL OPEN AGAIN
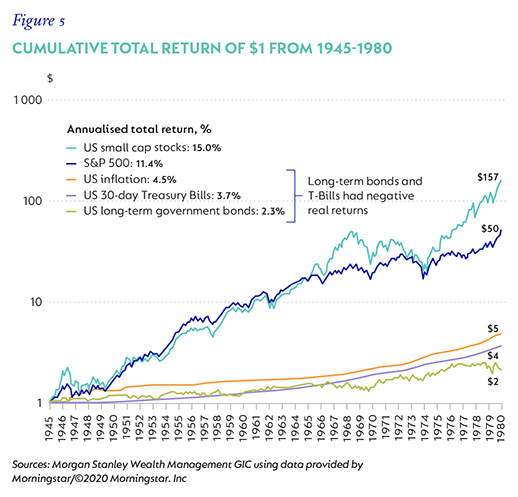
Notwithstanding the current recessionary conditions, which Morgan Stanley believes could be the fastest and steepest recession in history, resulting in spare capacity and economic slack, the world will eventually get back to work. From this low base of activity, pent-up demand (combined with huge stimulus) could be highly inflationary. In this scenario, the US experience after World War 2 is instructive and highlights the material underperformance and declining purchasing power of cash and government bonds (Figure 5). This is in stark contrast to the last few decades during which bonds have been the ultimate low-volatility, low-risk, uncorrelated and real-return generating asset:
- Since 1990 (30 years), the Bloomberg Barclays Global Aggregate Bond Index returned 5.7% p.a., less than 1% behind global equities, with a fraction of the volatility and drawdown risk. Since 2000 (20 years), this index has beaten equities by c.0.5% p.a.
- Since 1990 (30 years), the Bloomberg Barclays Global Aggregate Bond Index returned 5.7% p.a., less than 1% behind global equities, with a fraction of the volatility and drawdown risk.
- Since 2000 (20 years), this index has beaten equities by c.0.5% p.a.

As bonds approach the zero bound, the asymmetry of returns skews increasingly one way. Yields cannot be forever compressed, so the upside potential is limited (bond prices go up when yields go down). However, poor prospective returns from rates simply staying where they are, negative real returns from monetary debasement and negative absolute returns from a rise in interest rates are all possibilities.
While the inflationary scenario outlined above is only one potential outcome, it does inform the Strategy’s positioning and we continue to hold no developed market government bonds. In turn, we have built positions in assets that should perform well in an inflationary environment. Aside from the allocation to risk assets (equity, property and infrastructure), which comprised 65% of the Strategy at quarter-end, we also have 10% of the portfolio in gold and inflation-protected securities.
KEY PORTFOLIO ACTIONS
1. Active management of equity exposure
Walking through the changes in a volatile quarter such as this will help to illustrate the process. The quarter started with 60% effective exposure to equities. On 27 February, with markets not far off their highs (the MSCI All Country World Index was 522), exposure troughed at 54.9% as we grew concerned about the potential fallout from the virus amidst fairly widespread complacency in the market. Equity exposure peaked at 63.6% on 25 March (index level 428, c.20% lower. Considering the decline in the markets and the increase in exposure, one can see that the Strategy was a meaningful net buyer into the decline. While we will never time these actions perfectly, with a disciplined, rational process and a valuation philosophy that is rooted in the long term, we aim to have lower equity exposure when risks and valuations are high, and higher exposure when prospective returns are higher. Simple, but not easy.
2. Changes in equity holdings
Most of our large holdings going into the quarter were well positioned for the coming economic stress. In the top 10, Chinese internet businesses Tencent (via Naspers) and Alibaba are arguably net beneficiaries, being leaders in gaming and ecommerce. Charter Communications, a broadband provider in the US, is seeing much higher demand for their essential internet service, although the business is not immune, and cord-cutting will accelerate and subscriber growth will slow as the unemployment wave hits.
Tobacco businesses Philip Morris and British American Tobacco have seen stable demand. Airbus is an obvious exception. With entire countries in lockdown and many airlines around the world facing bankruptcy, orders of new aeroplanes are being delayed and cancelled. The stock ended the quarter down more than 50%, however Airbus has a net cash balance sheet that should see it through this crisis. Deliveries will be cut substantially over the next couple of years, but looking through this extended period of disruption, our estimate of normalised earnings power justifies a significantly higher share price.
The Strategy took advantage of a few anomalies – good businesses that initially sold off in line with the market, but whose prospects had only changed marginally. Unilever is a case in point. The stock traded close to 14 times earnings and with a dividend yield nearly 4.5% at the lows, which we thought provided good value, in particular when the potential range of outcomes for the average business had widened so considerably. Unilever ended the quarter just outside our top 10 holdings.
3. Other changes
Within credit, the most meaningful portfolio actions centred on investment-grade credits to take advantage of dislocated credit spreads (as shown in Figure 5). While these actions don’t dramatically change the return profile of the portfolio, they help at the margin. Examples of near-dated issues that were purchased include:
- Berkshire Hathaway (AA-rated) August 2021s at a credit spread of 250 basis points (bps) over Treasuries.
- GlaxoSmithKline (A-rated) May 2022s at a credit spread of 290bps.
OUTLOOK
Markets could very well remain volatile as the nature of the pandemic evolves and progresses. As a team, we are focused (as always) on researching individual businesses, assessing their long-term earnings power, understanding the potential impact that this black swan event may have on the investment case, managing risk and adjusting the portfolio accordingly. While the backdrop has changed dramatically, our process hasn’t.
Disclaimer
 Global (excl USA) - Institutional


