 Global (excl USA) - Institutional


The 2008/2009 Global Financial Crisis (GFC) precipitated a remarkable period in financial markets. Global inflation was significantly lower in the decade following GFC, and financial repression across developed markets ensured a bonanza of borrowing at some of the lowest interest rates in the history of the globe. Just over a decade later, this trend was further entrenched by the actions taken by global governments to drag themselves out of the Covid-induced recession.
STRATEGY PERFORMANCE
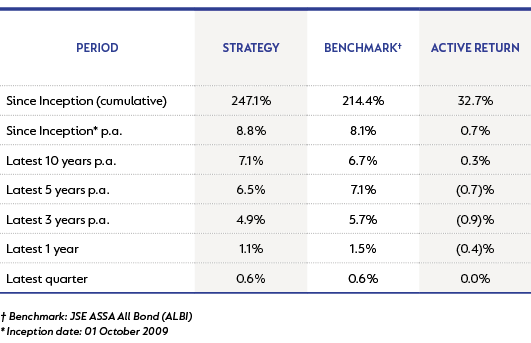
The Strategy’s performance as at 30 September 2022 is shown below:
All good things in life come at a price and, after extended indulgence, the cost to the global economy manifested in a significant jump in the cost of living. Inflation has come back to bite, and central banks must choose between tightening their belts or loosening their pants. The uncertainty spawned by the rapidly changing macro variables has resulted in not only a significant increase in volatility, but also a sizeable change in asset valuation.
This year, market volatility (Volatility Index) is up c.80%, global equities (MSCI World Index) are down c.25% and global bonds (FTSE World Government Bond Index) are down c.21%. US bond yields have risen more than 300 basis points (bps) since their lows in 2020, which has led global bond yields higher. And yet, no matter how bad things are, you can always make it worse. The UK signalled a policy pivot towards a largely unfunded pro-growth policy, which saw their 30-year bond yields soar to above 5%.
Amid all this volatility, SA bonds were not spared, with the FTSE/JSE All Bond Index down 2.11% in September, bringing its year-to-date return to -1.34%. When translated to dollars (-13%), this is significantly better than global bond returns. Despite real yields ticking higher, inflation-linked bonds (ILBs) still offered some protection in the sell-off, as they were down 1% over the quarter, bringing their return for the year to date to 2.23%, which is still above bonds but below cash (1.35% over the last quarter and 3.57% year-to-date).
SOUTH AFRICA’S INFLATION OUTLOOK
In South Africa (SA), inflation peaked in July at 7.8% and should return to the target band (3%-6%) by the second quarter of 2023 (Q2-23). Many of the factors that pushed SA inflation up (food and fuel) have already started to recede, but inflation will prove stickier than previously anticipated, averaging above 5% over 2023 and 2024. This is on the back of upside risks stemming from administrative prices (Eskom has applied for a 32% tariff hike for 2023/2024) and large (>6%) government wage increases.
The South African Reserve Bank (SARB) started the hiking cycle earlier than strictly needed but remains focused on anchoring inflation closer to 4.5%. Recent rhetoric coming out of SARB suggests they will take the repo rate into restrictive territory to prevent inflation from spinning out of control – such as we are seeing in many developed market economies. This implies that the SARB is most likely going to overreact and take the repo to 7.5% by the first quarter of 2023 (Q1-23).
Given the poor growth outlook, they will probably be forced to take the repo back down to 6.5% sooner than their forecasts suggest. Market pricing is still more aggressive, expecting the repo rate to peak at 8.25% by end of Q2-23, suggesting that bond yields still embed significant inflation and interest rate premium.
The upcoming Medium-Term Budget Policy Statement will provide more guidance on SA’s fiscal position, but this year’s revenue overrun should provide significant breathing room. However, the possibility of a higher-than-budgeted-for wage deal for public servants and an extension of the Social Relief Distress Grant into a more permanent basic income grant could weigh on the longer-term prospects for fiscal consolidation. The transfer of Eskom debt onto the sovereign balance sheet should be a positive as it eliminates a known risk that hangs over the economy; but whether further money is injected into the entity to speed up maintenance remains a further risk.
Nominal growth rates should be higher since inflation will be higher than initially expected, and combined with better tax collection at SARS, tax revenue could remain buoyant. At this point, although there remain risks to the current fiscal trajectory, we believe that there is still sufficient breathing room over the short to medium term, but growth needs to be higher to completely mitigate the risk posed by the increasing debt burden.
GLOBAL IMPACT ON LOCAL CONDITIONS
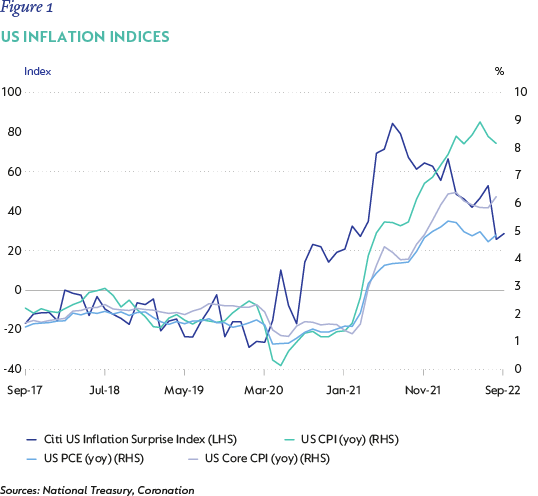
In the past two quarters, global monetary policy and bond yields have become a much larger driver of local bond valuations. US 10-year bond yields have traded in a 3.5%-4% range more recently as concerns over structurally higher inflation has eroded their value. US inflation peaked as 9% in June 2022, however, the decline from that high has not been as quick as the market expected. More importantly, although the relevant inflation signals have been surprising to the downside (CITI US Inflation Surprise Index), the readings have not surprised significantly below current forecasts. The core elements of the CPI basket as well as personal consumption expenditure (Figure 1) have all remained uncomfortably high, signalling that although headline inflation might be heading lower, underlying inflationary pressures remain.
This has two key implications for our US economic expectations. Firstly, our expectations for long-term headline inflation in the US needs to be adjusted higher from 2.5%-3% to 3%-3.5%; and secondly, the Federal Reserve Board (the Fed) is more likely to move policy rates into much more restrictive territory, driving the economy into recession to address this inflationary problem. Current market pricing has adjusted to recent Fed guidance, putting the peak in the federal funds rate at 4.5% by Q1-23 and remaining above 4% until 2024.
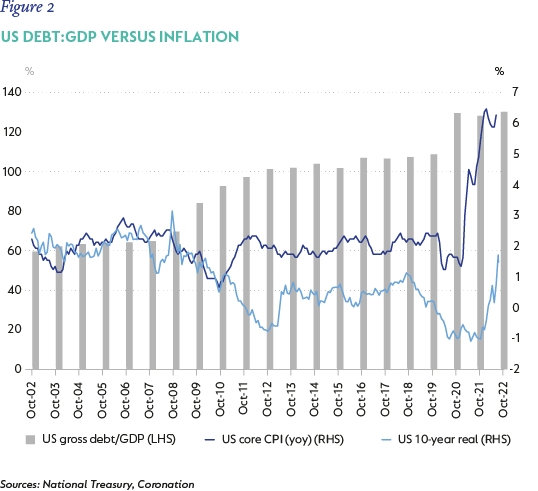
One of the key elements of debt sustainability is the ability to keep the cost of financing low. Current 10-year real yields in the US are back up to levels last seen in the 2000s, which can be expected with core CPI well above those levels. However, one thing that has changed significantly is the US debt load, which has more than doubled over the same period. Assuming that core CPI recedes to levels of 2.5%-3% (headline generally sits 0.25%-0.5% above), this would imply a real 10-year yield of around 1% (given historical precedence) but, given the much higher debt load, this real yield would need to sit closer to 0.5%. This would put the normal fair value of the US 10-year bond at 3.5%-4% (3%-3.5% + 0.5% real yield) – see Figure 2.
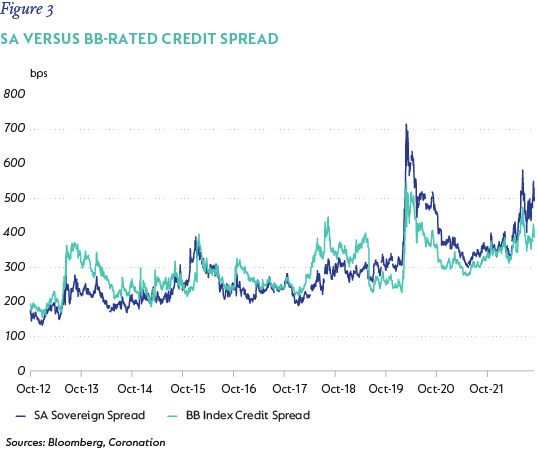
The other element that needs to be considered before we derive the implication for SA bond yields is the level of risk aversion currently being priced into our credit spread. In Figure 3, we notice two key points. Firstly, credit spreads in general are elevated when compared to history. Secondly, SA remains even more elevated compared to its history and peer group. This indicates that there is significant room for SA’s country spread to compress from current levels of 490bps to between 350bps and 400bps.
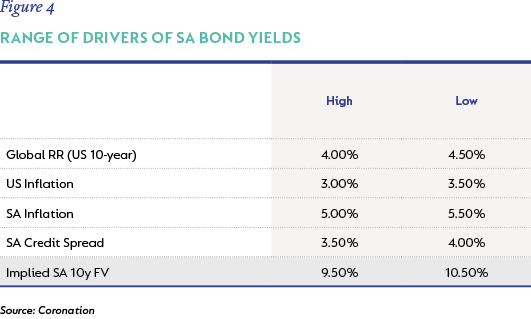
This brings us to our fair value for SA 10-year bonds. The high and low expectations (Figure 4) for all the variables we consider to be key drivers of our SA 10-year bond yields indicates a fair value range of 9%-10%, which compares very favourably to current market levels of 11.35% and provides us with enough comfort that SA bond yields remain very cheap when taking a medium- to longer-term view.
INFLATION-LINKED BONDS – SHORTER DATED LINKERS REMAIN ATTRACTIVE
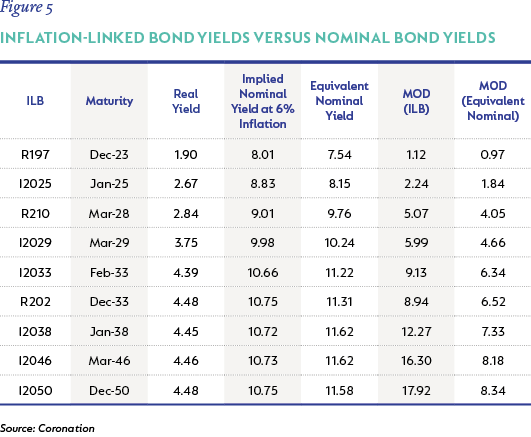
ILBs have had a decent run and their outperformance relative to nominal bonds requires us to relook at valuation. We have analysed the various ILBs, their real yields and what their implied nominal yields would be at 6% inflation, and compared them to the equivalent nominal bond of the same maturity (Figure 5). In addition, we considered the modified duration of both the ILBs and the nominal bonds for the various maturities. Even though real yields remain quite elevated in the longer end (>10 years), one would still need inflation in excess of 6% for ILBs to outperform their nominal equivalents.
When taking into consideration that the risk (relative modified duration to nominals) carried by ILBs are multiples of their nominal counterparts, it makes sense that one should instead own nominal bonds in that area of the curve. The shorter end of the curve offers a much better risk/return profile with a marginally higher duration risk, which is amply compensated for by better return prospects than those of their nominal bond counterparts. As such, we continue to advocate shorter-dated ILB positions for bond portfolios.
LISTED PROPERTY – SELECTIVE VALUE, REMAIN CAUTIOUS HOWEVER
The local listed property sector was down 6.5% over the month, bringing its 12-month return to -10%. The balance sheet concerns in the sector have subsided, as companies have managed to introduce dividend payout ratios (with some withholding dividends entirely) and selling off assets in order to recapitalise themselves. Going forward, operational performance will remain in the spotlight as an indicator of the pace and depth of the sector’s recovery. We believe that one must remain cautious due to the high levels of uncertainty around the strength and durability of the local recovery. However, certain counters are showing value, given their unique capital structures and earnings potential. These counters remain a core holding within the Strategy. We remain vigilant of the risks emanating from the dislocations between stretched valuations and the local economy's underlying fundamentals. However, we believe that the Strategy’s current positioning correctly reflects appropriate levels of caution.
TO CONCLUDE
Global monetary policy normalisation has gathered pace to combat the highest inflation in decades. Central banks are willing to sacrifice growth by taking policy rates into restrictive territory, to ensure inflation does not get disorderly. This has pushed global bond yields to levels that have not been seen since before the GFC. Risk sentiment has soured as volatility has soared and asset prices have tumbled. SA bonds have fallen victim to this global fallout, but still embed a significant buffer both from an inflation and risk premium perspective. The uncertainty around global inflationary outcomes will ensure that volatility remains elevated, but, over the longer term, valuations of SA bonds should provide a reasonable buffer, as they have already, since they trade at significant discount to fair value. We continue to advocate an overweight position in SA bonds and believe short-dated ILBs still warrant a place in portfolios.


Explore Investment Insights on the global economy, markets and topics related to our business.
Subscribe to our Corospondent newsletter