 United States - Institutional


Investment views
Bond Outlook
"In the universe, the only constant is change, and the only certainty is uncertainty." – Heraclitus
The Quick Take
- Geopolitics continue to inject volatility into the market, but emerging markets have shrugged this off and continue to reduce policy rates
- In SA, all eyes are on inflation target revisions, and the balance of long-term benefit vs short-term suffering
- We support a more cautious approach that factors in the prevailing headwinds, but that a downward revision would be positive over time

Geopolitical risks and US policy uncertainty increased market volatility in the second quarter of 2025 (Q2-25). Developed market bond yields rose, with US 30-year Treasury yields exceeding 5%, driven by tariff policies, rising deficits, and inflation concerns. Emerging market bonds faced volatility from US trade policies, but fundamentals remain robust in these markets, with many central banks continuing to cut rates, boosting local currency bonds. South African (SA) assets recovered from the shock of April’s “Liberation Day” tariffs and anxiety about the stability of the Government of National Unity (GNU), boosted by expectations of a lowering of the inflation target later this year.
The FTSE/JSE All Bond Index (ALBI) returned 2.28% over the month of June, bringing its return for Q2-25 to 5.88% and 18.36% over the last 12 months. Over all these periods, bonds with a maturity of less than 12 years performed the best, as yields in this area saw significant compression. The SA 10-year bond yield compressed by c. 70 basis points (bps) over the last quarter and 145bps over the last 12 months. However, yields on bonds with a maturity of greater than 10 years saw less compression, keeping the 20-year bond yield more than 100bps above that of its 10-year counterpart. Inflation linked bonds (ILBs) continued to underperform both nominal bonds and cash, with a return of 0.62% over the last month, 0.88% over the quarter, and 7.29% over 12 months. The rand has underperformed its emerging market peer group over the last year but still has a positive performance versus the US dollar, which has pushed SA bond performance above that of the FTSE World Government Bond Index in rand terms (0.17% month to date, 1.05% quarter to date, 5.59% over 12 months).
IFS AND BUTS
A big driver of local bond returns in Q2-25 was a pronouncement by the SA Reserve Bank (SARB) that, together with National Treasury, they were closer to an agreement to move the inflation target lower to a 3-percentage-point target (+/-1% tolerance). As we have previously stated, the move towards a lower target will have significant longer-term benefits. However, over the shorter term, economic sacrifice could be higher than the SARB’s current estimates, especially given the impact of global uncertainty on local growth. We hope that the SARB is given at least 18-24 months to reach the target so as not to stifle current growth prospects through the likely high real borrowing rates that could be a consequence.
The SARB presented a scenario for the nominal repo rate (the real policy rate still remains high at closer to 3%), showing it moving to a level of 6% over 12 months if inflation is anchored at 3%, which is 1% lower than it would be under a 4.5% target. This would be a good outcome for the economy, but can they anchor inflation closer to 3% and how would it impact bond yields if the nominal repo rate gets to 6%?
SARB's latest research on this matter, Less risk and more reward: revising South Africa's inflation target, was published as recently as 29 May 2025. They suggest that lower headline inflation could lead to lower inflation in stickier inflation segments, such as administrative prices and wages. Their key argument is that a wide range of input costs (domestic and imported) feed into various regulatory approaches to determining administrative prices, implying that lower headline inflation rapidly lowers administrative price inflation. Unfortunately, the state of infrastructure (water, electricity, logistics) in SA is dire and administrative prices have been increasing ahead of headline inflation in order to fund its rehabilitation. This is unlikely to change in the short- to medium term.
Currently, 9% of the inflation basket is derived from local administered prices, and, if these continue to increase at 6% (electricity prices are set to increase by more than this over the next few years), then the rest of the basket needs to increase by 2.7% to bring inflation to 3%. Over 50% of the current inflation basket is driven by services prices, which are heavily influenced by wage inflation. Recent wage settlements have all been well above even the current 4.5% target. Additionally, long-term expectations for inflation, although lower, remain above 4.5%, despite inflation being below 4% for almost a year now. In previous episodes, when the target was explicitly moved lower (2017/2018), it took inflation expectations 18-24 months to adjust. These elevated expectations, combined with sticky administrative prices, suggest a much slower path to anchoring inflation at 3% and, thus, a much slower path to a 6% nominal repo rate.
THERE ARE SERIOUS QUESTIONS
A 6% nominal repo rate should benefit bonds, but should all bonds benefit equally, or are there some areas of the curve that would do better than others?
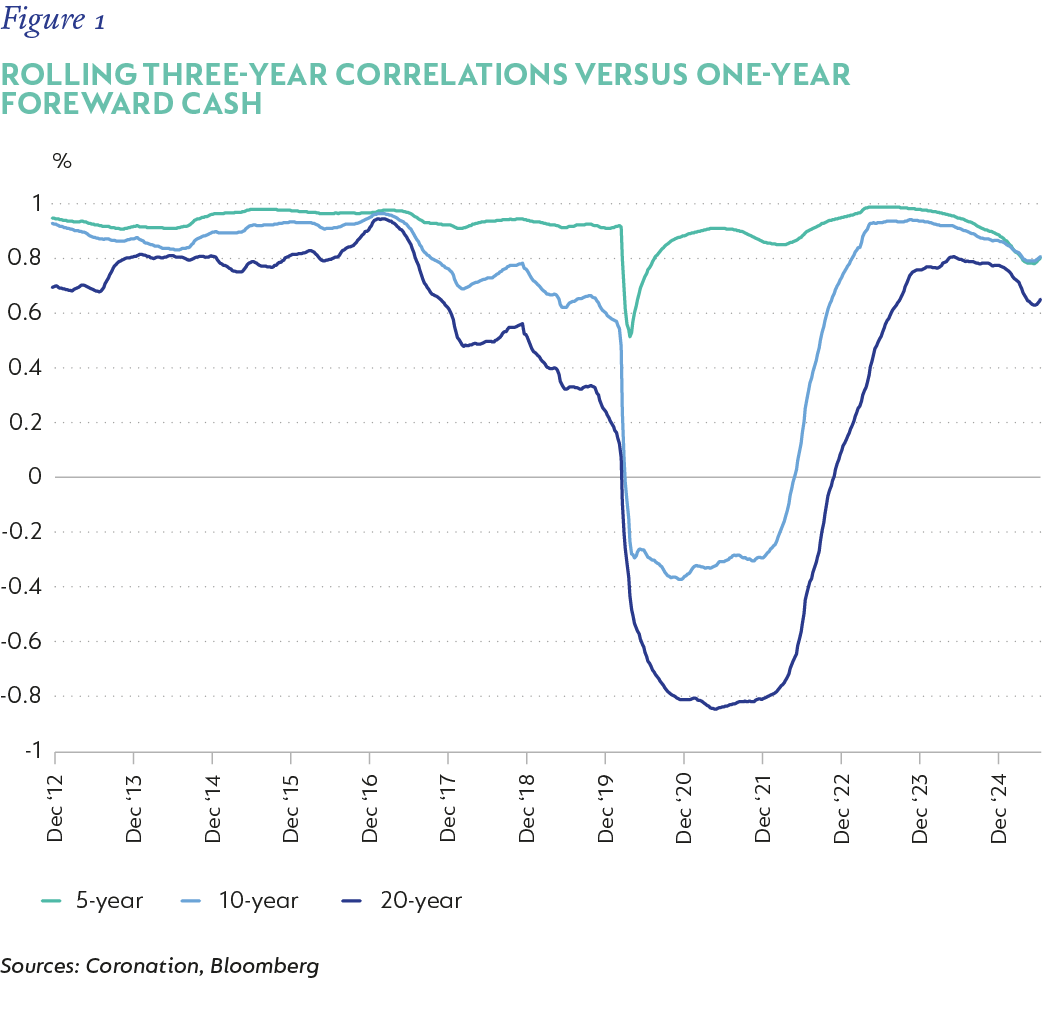
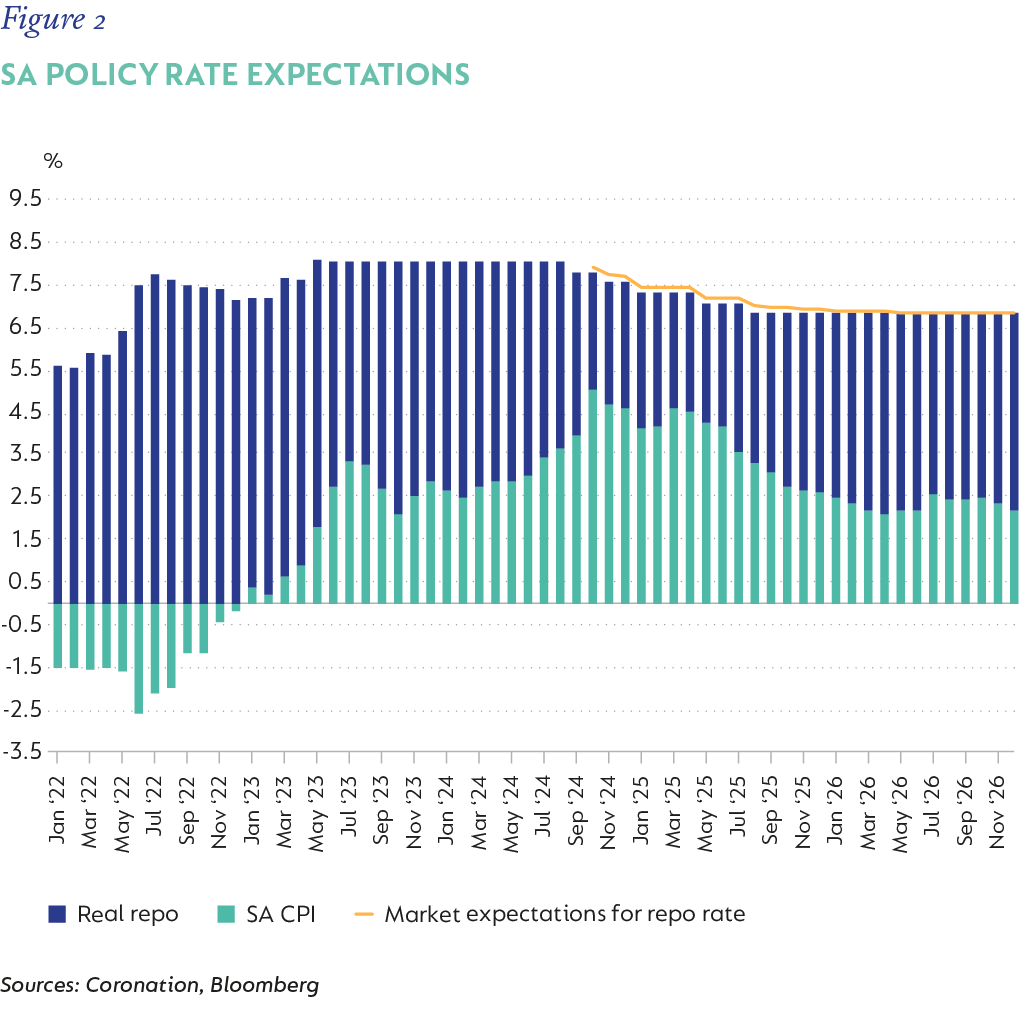
Figure 1 shows the rolling three-year correlation of five-, 10- and 20-year bond yields versus the one-year expected cash return. The five- and 10-year bonds are much more sensitive to one-year forward cash expectations, although this has decreased significantly since pre-Covid. The 20-year area of the curve is driven less by one-year forward expectations than by fiscal outcomes. Coming out of Covid, despite the repo rate plummeting, these bonds actually sold off due to the deterioration in the fiscal outlook, and this has continued to weigh, as can be seen in their lower correlation than we saw pre-Covid. Current market pricing is for the repo rate to reach 7% (Figure 2) and stay there until the end of 2026. This is due to the fact that inflation is expected to pick back up to above 4% in the later part of 2025 and stay slightly closer to the midpoint of the band (4.5%) until the end of 2026. The average correlations of the five-, 10-, and 20-year bonds relative to returns from one-year forward cash are 90%, 60% and 40%, respectively. This suggests that if the repo rate moves towards 6%, five- and 10-year bonds are likely to see yields compress by between 60bps-90bps, while 20-year bonds could see yields lower by around 40bps. This would be a good tailwind for bond performance.
We can thus conclude that if the repo rate were to move lower to 6%, there is scope for bonds to deliver handsome returns, primarily in the five- to 10-year area. However, it would require inflation and the expectations thereof to be anchored at 3%. Given our expectations of inflation moving higher towards an average of above 4% until the end of 2026, how sticky some components of the basket currently are, and how slow expectations have been to reduce (even though recent experience has been lower), it seems unlikely that this tailwind will materialise in the next 12 to 15 months. This does not mean it cannot be achieved, but that over the next 12 to 15 months it seems unlikely that inflation will remain at 3% and it might transpire that the SARB might have to keep rates high (7%) for longer in order to secure credibility and belief in a lower inflation target.
UNEASY POSITION
Budget 3.0 was finally passed on 21 May 2025. Despite the collective sigh of relief on the passing of the budget, we must not lose sight of the fact that the underlying budget still came with a larger expenditure envelope. A significant R180 billion extra will be spent over the next three years on a combination of infrastructure, wages, Social Relief of Distress Grant extension, and an increase in frontline worker headcount. The intention is that this will be funded by the contingency reserve (R21 billion), a reallocation of provisional expenditure (R81 billion), and the balance in revenue measures (bracket creep, unannounced additional policy measures, and increased revenue collection by SARS). All of the expenditure put in place cannot be rolled back, but revenue measures rely on growth outcomes. Thus, if growth continues to disappoint, the funding gap and, hence, the debt-to-GDP ratio (debt:GDP), is at risk of increasing further. As it stands, we still have debt costs averaging 6% of GDP over the forecast period, consuming well over 20 cents of every rand collected as revenue. This does not place SA in a zone of comfort.
In order to consolidate our debt position, we need to run primary surpluses for the years to come; that is, we must spend less than we receive (before interest payments). Based on our current funding rate, growth rate, and debt:GDP, we need to spend 2%-3% less than our revenue (effectively run primary surpluses of 2%-3%) to ensure debt:GDP does not increase further. This means that either we must spend 2%-3% less or we must increase our revenue by 2%-3% every year. The former will prove difficult to do with the current high levels of unemployment and deteriorating infrastructure. Budget 3.0 highlighted this with its increased expenditure envelope. This only leaves revenue as a viable alternative, and, since revenue depends on growth, we would need real growth in excess of 2%-3% per year in order for debt to stabilise at current levels.
AS THINGS STAND
10-year South African government bonds (SAGBs) are currently fairly priced for a 4.5% inflation outcome, which is more likely over the next one to three years, for reasons specified earlier (4.5% SA risk free rate + 4.5% SA inflation outcome – a 2.5% US inflation outcome and a 3.32% SA credit spread = 9.82% versus 9.86% currently). However, the yield curve is steep with the 20- and 30-year bonds trading at their widest spreads relative to the 10-year bond since Covid (Figure 3). One would imagine that with the yield curve this steep, longer end bonds (>15-year maturity) should offer attractive risk/return prospects (Figure 4).
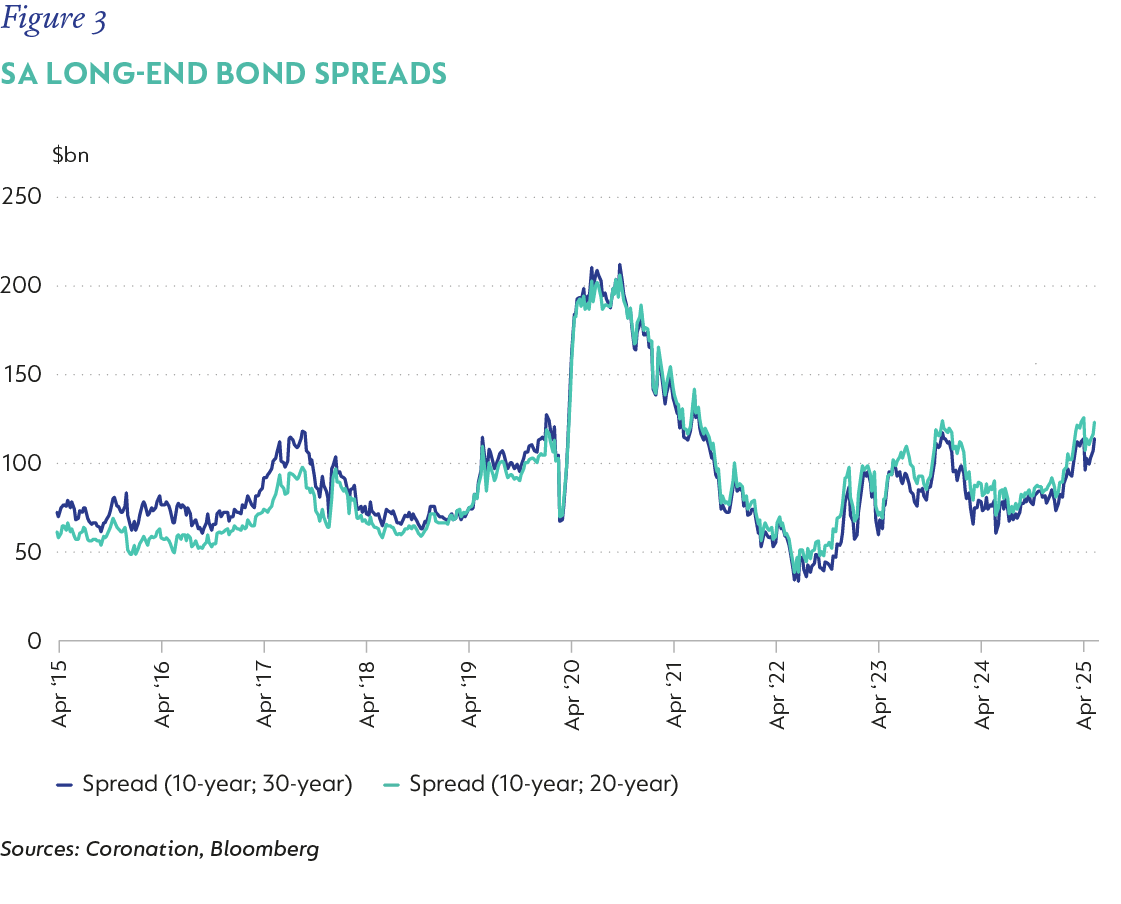
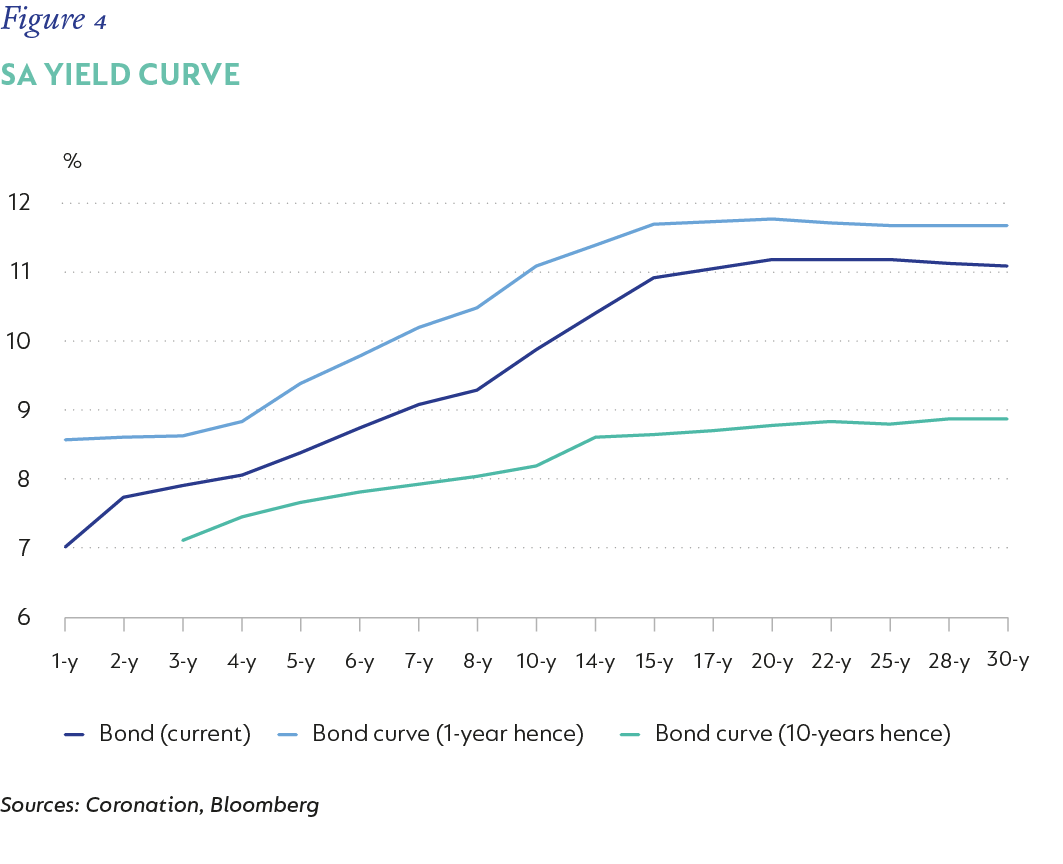
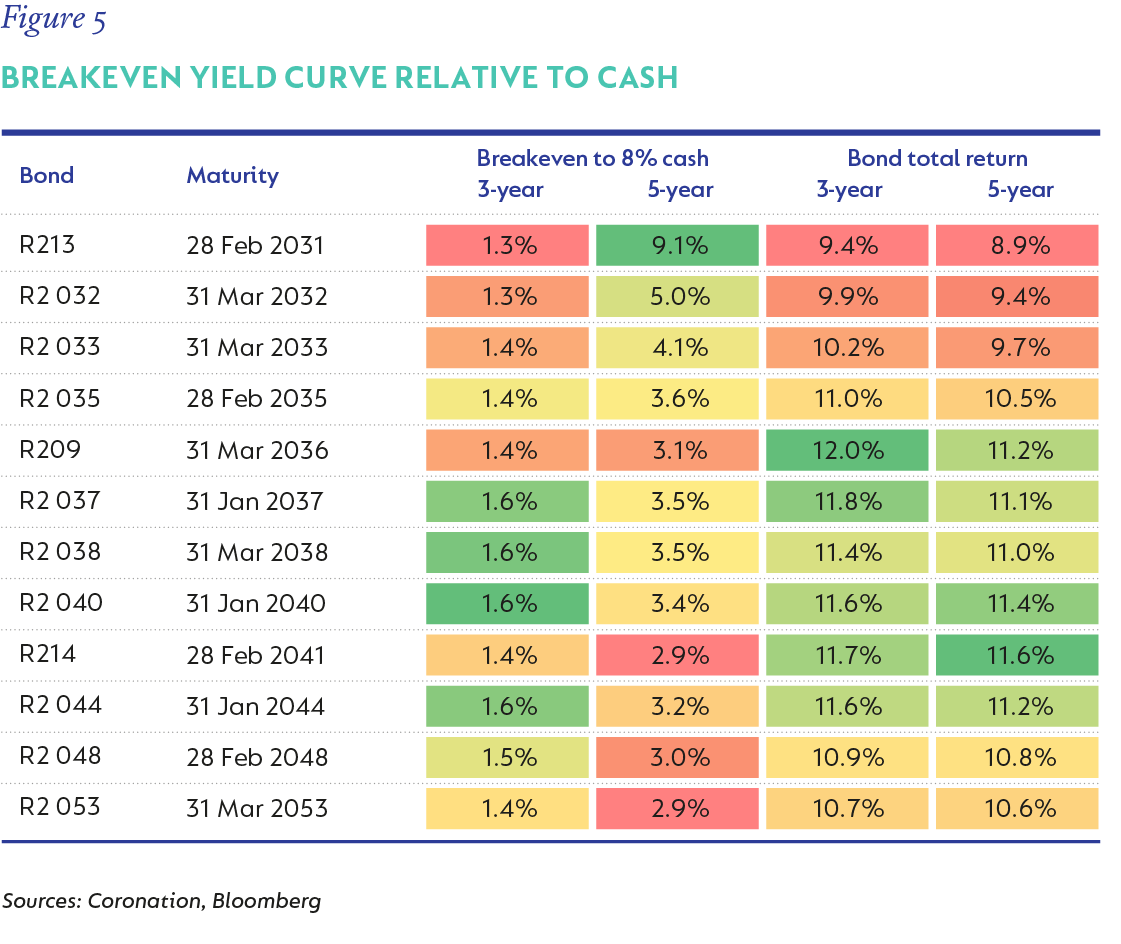
Figure 5 looks at the breakeven of the yield curve relative to cash (how much yields can rise before they equal a return of 8%) over three and five years. The bulk of protection sits in bonds with a maturity of less than 15 years. In addition, if we look at the total return prospects of each of these bonds, assuming only roll down (bond yields change as they get closer to maturity, if interest rates stay the same) over three and five years, then bonds with a maturity of less than 15 years are the most attractive. Combining this with the breakeven (inherent protection in yields relative to cash) suggests the sweet spot on the yield curve remains in the 10- to 15-year band.
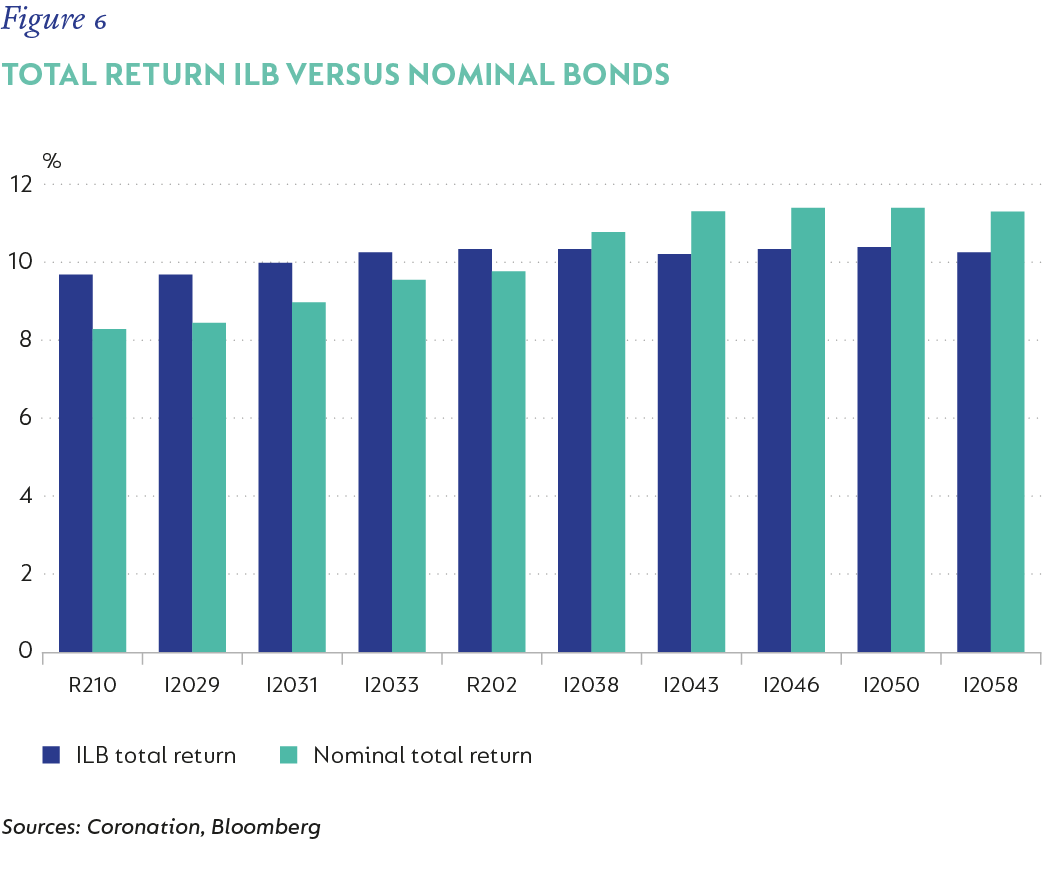
ILBs have continued their underperformance over the last quarter, primarily due to the SARB maintaining the real policy rate at elevated levels and realised inflation being below expectations for an extended period. However, inflation is currently close to, if not at, its trough, and we expect it to average 4%-4.5% over the next 12 months. This, combined with high starting real yields, makes ILBs quite attractive relative to certain nominal bonds.
ILBs are also less correlated to nominal bonds, given their inherent risk-protection attributes. These are present since inflation in SA has historically been very closely tied to the currency performance, and because the currency is the release valve for any SA (and global risk-off) specific difficulties, it has a direct feed through to inflation. This makes ILBs a good risk offset to hold in a portfolio, specifically in uncertain times. In the graph below, we show the expected total return of nominal bonds versus ILBs assuming static yields and inflation at 4.25%. The valuation argument for owning ILBs with a maturity of less than six years is still very strong as they provide a decent uplift relative to their nominal counterparts (Figure 6).
IN SHORT
The global landscape remains uncertain; however, emerging markets have continued to outperform developed markets. SABGs have flourished as local anxiety has eased and expectations for a lower inflation target has bolstered prospects for a lower repo rate. They are now trading at or close to fair value, and to see a further rerating, one would need to see a significant change in fiscal prospects or monetary policy accommodation. Anchoring inflation at 3% will take longer, thus delaying any tailwinds for bonds from further policy easing and achieving substantial fiscal consolidation would require growth in excess of 2%-3% p.a. Global bond flows have turned more supportive of emerging markets, given their relatively cleaner balance sheets, and could support further compression in bond yields if that trend gains momentum. Valuation suggests that the best value on the yield curve sits in the 10- to 15-year band and in ILBs with a maturity of less than six years. As such, we would advocate for a neutral position in SAGBs, weighted more towards the 10- to 15-year area, with a decent allocation to shorter dated ILBs.
Explore Investment Insights on the global economy, markets and topics related to our business.
Subscribe to our Corospondent newsletter