 South Africa - Institutional


IN THE EARLY part of this millennium, the US accounted for about a third of global growth. Since then, the country’s contribution has reduced to just under 25%, but arguably its influence on financial markets has increased. The US 10-year bond led the performance of global bonds in the quarter to end-June 2019 (Q2-19). Increasing concerns over lower growth due to the intensification of the US-China trade war, combined with benign inflation expectations, led to more dovishness from the US Federal Reserve (Fed) and the European Central Bank, which fuelled the global bond market rally. By the end of June, the US 10-year bond had rallied to 2% (down from 2.7% at the beginning of 2019), while approximately $13 trillion worth of global government bonds slipped into negative yielding territory. This spurred a rally in nearly all emerging market currencies and bonds, as the carry trade came back into vogue.
The All Bond Index (ALBI) was up 3.7% over Q2-19, bringing its return to 11.5% over the last 12 months. This performance is well ahead of cash (Q2-19: 1.7%; rolling 12 months: 6.9%) and inflation-linked bonds (ILBs) (Q2-19: 2.9%; rolling 12 months: 4.0%). The outperformance of the ALBI was driven by the seven- to 12-year area where bonds rallied 30 basis points (bps) to 50bps versus bonds with maturities longer than 12 years that only rallied 8bps to 10bps. Prospects of rate cuts in South Africa buoyed the seven- to 12-year area, while further fiscal deterioration due to lower growth and larger state-owned enterprise (SOE) bailouts weighed heavily on longer-dated South African government bonds (SAGBs). The strong performance of the ALBI over the last quarter, combined with the appreciation of the rand (2.3% versus the US dollar), put SAGB performance at 6.6% in US dollar terms, slightly ahead of global emerging market bond performance of 5.7% in US dollars (JP Morgan Government Bond Index – Emerging Markets Global Diversified Composite).
Top-down valuation of SAGBs is still quite attractive. Ten-year nominal yields of 8.8% with an implied real yield of 3.9% (one-year forward) is well above the emerging markets average nominal rate of 5.7% and average real rate of 1.7%. In addition, 10-year SAGBs yield 6.8% (8.8% minus 2%) more than the US 10-year. This is 1.2 standard deviations higher than the 10-year average, suggesting some degree of cheapness. However, as history has shown us, the bottom-up fundamental drivers of the local economy have been a much larger influencer of bond valuations over time. The two questions that need to be answered are around the sustainability of global bond yields (specifically US bond yields) and what magnitude of fiscal deterioration is being priced into local SAGBs.
In the US, over the next two years, the economy is expected to remain close to full employment, personal consumption expenditure (the Fed’s preferred measure of inflation) is likely to remain sticky at around 2% and growth is expected to decelerate from 2.5% to 1.8%. In addition, average hourly earnings of employees (a large indirect contributor to US inflation) have been running well over 3% for almost 18 months and in excess of 2% for at least five years.
These are hardly the signs of an economy that is going into recession, or one that warrants a serious amount of monetary policy accommodation. The market is currently looking for approximately 1% worth of interest rate cuts over the next two years. The Fed’s own projections suggest 0.5% worth of cuts over the next six to nine months and rates moving back up to current levels by the end of 2020. Given what is currently known about US inflation, growth and the US-China trade-war truce, the current pricing of the US 10-year bond seems expensive. Fair value for this instrument is probably closer to 2.75% to 3%, based on expected inflation of 2% and a real policy rate of 0.75% to 1% (a real policy rate more reflective of an economy growing at 2% per year and inflation at 2%).
On the local front, fortunately, inflation should average 5% until the end of 2021 due to the poor demand environment and subdued services prices. Unfortunately, growth is expected to average less than 1.5% over the same horizon, given the constraints on consumer spending and corporate investment. This benign growth and inflation environment should allow the South African Reserve Bank to reduce interest rates by around 0.5% over the next six to nine months, which is supportive for local bonds. However, given the slow nominal growth environment (a combination of slow real GDP growth and low inflation) and the need for more extensive support for SOEs (for example Eskom), government finances are set to deteriorate even further. Just using current economic assumptions, the budget deficit is likely to be well below -5.5% over the next three years and the debt-to-GDP ratio above 60% by 2021. Frontloading further support for Eskom will worsen these numbers. The budget deficit and the debt-to-GDP ratio will move to approximately -6% and 60%, respectively, a lot earlier (this does not include a debt transfer from Eskom’s balance sheet to the sovereign’s). The net effect would be a further deterioration in South Africa’s creditworthiness, a downgrade to sub-investment grade by Moody’s and an exit from the Citigroup World Government Bond Index (WGBI) by March 2020, if not sooner.
The fair value for 10-year SAGBs is approximately 8.62% to 8.82%. This is based on expectations of a US 10-year bond yield of 2.75% to 3%, South African expected inflation of 5%, US expected inflation of 2% and a South African credit spread of 2.87% (0.2% higher than the spot rate to factor in a further deterioration in South Africa towards subinvestment grade levels). At current levels of 8.68%, the South African 10-year bond sits in that fair value range (8.62% to 8.82%), but does not offer a large margin of safety. At best, it only warrants a neutral to slightly underweight allocation, given the impending fiscal risks.
LONGER-DATED SOUTH AFRICAN GOVERNMENT BONDS LOOKING ATTRACTIVE
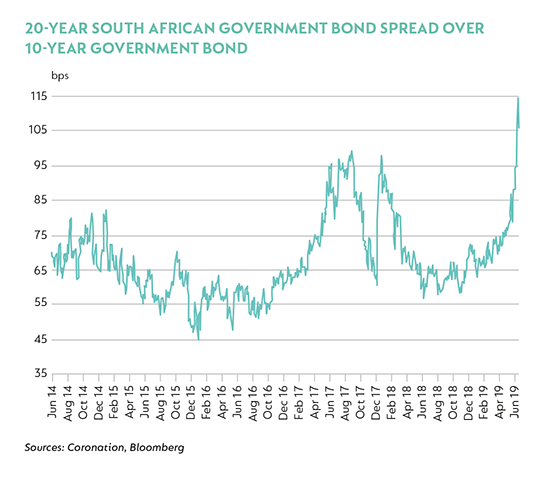
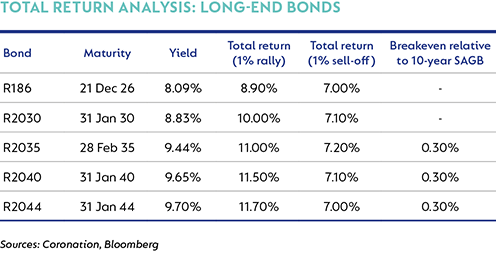
In Q1-19, as evidenced by the performance of the various sectors of the ALBI, longer-end SAGBs (in the 20- to 30-year area) materially underperformed 10-year SAGBs. In the last year, the spread that the 20-year SAGB trades above the 10-year SAGB has moved from 0.5% to currently more than 1% above (see the first graph overleaf). On the surface, this looks like an attractive entry point. In the first table, we show a total return analysis for a few government bonds over three years in a scenario where bonds sell off or rally 100bps (1%). In addition, the last column shows the breakeven move for the longer-dated bonds relative to the 10-year bond (R2030) – that is, by how much those bonds can sell off before their total return equates to that of the 10-year bond. The results of our analysis are supportive of longer-dated SAGBs. In the event that bonds rally aggressively (100bps), longer-dated SAGBs outperform; if bonds sell off aggressively (100bps), one is no worse off than being invested in a 10-year SAGB. These bonds can sell off 30bps more (and so steepen 30bps relative to 10-year SAGBs) before their performance equates to the 10-year SAGB. Based on these results, the case for allocating capital to the long end of the SAGB curve is very compelling.
SHORTER-DATED INFLATION-LINKED BONDS MORE FAVOURABLE THAN SHORTER-DATED NOMINAL BONDS
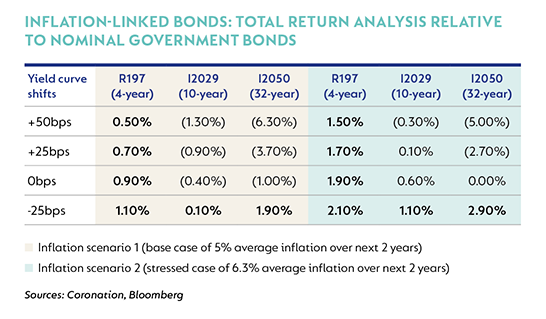
ILBs have underperformed nominal bonds for over 10 years now, with the underperformance being most pronounced in the last two years (ALBI 10.8%; Composite Inflation-Linked Index [CILI] 3.1%). This underperformance has been driven by a rally in nominal bonds and a sell-off in ILBs. Real yields have moved higher by approximately 150bps to 200bps over the last five years, depending on which area of the curve one is looking at. Most of the ILB yield curve trades close to, if not above, a real yield of 3%. This absolute level of real yield does seem attractive relative to history. In the following table, we run a total return analysis for nominal SAGBs and ILBs for parallel shifts in the yield curve (+50bps, +25bps and -25bps) and two inflation scenarios (average inflation over the next two years of 5% and 6.3%). For the ILBs, we show the relative total return to that of nominal bonds; for example, 0.7% implies, for that bond and scenario, that the ILB outperforms the nominal bond by 0.7%. As demonstrated in the table, the shorter-dated ILBs are more attractive than nominal bonds under all scenarios. Shorter-dated ILBs therefore warrant a more favourable allocation in a bond portfolio relative to shorter-dated nominal bonds.
CAUTIOUS ON ADDING CREDIT AT CURRENT LEVELS
Corporate bonds (credit) have been a valuable tool within a bond portfolio when it comes to alpha generation. In the last two years, there has been a significant compression in corporate bond spreads that has made credit an outperformer among all asset classes.
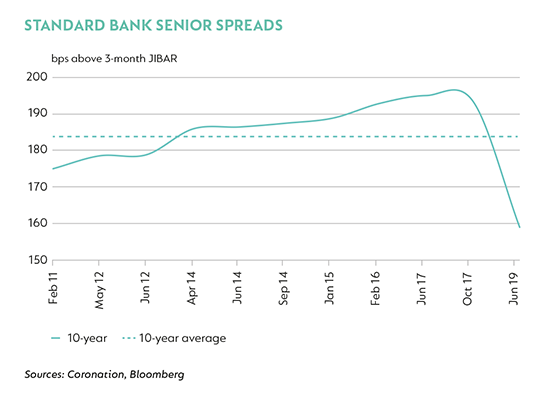
However, one must not forget that holding credit assets in a portfolio is not riskless. Credit spreads do move, as is evidenced in the graph below, and being caught on the wrong side of the credit spread move can be very painful. In the last 10 years, the ALBI has increased in risk (modified duration), as issuance in longer-dated SAGBs (maturity >12 years) has increased, resulting in over 60% of the index now comprising longer-dated SAGBs. In the last decade, the modified duration of the ALBI has moved from approximately 5.5 years to 7.1 years, and the yield of the ALBI relative to a 10-year SAGB has moved from 0bps to 50bps over.
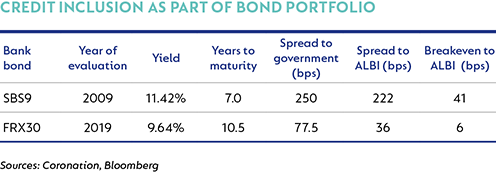
This has meant that the hurdle for holding credit assets has moved higher. In the table below, we show fixed-rate credit spreads, relative to SAGBs, relative to the ALBI, and the breakeven-credit spread move relative to the ALBI (how much credit spreads can widen before that credit asset underperforms the ALBI). As is evident, the compression in credit spreads, combined with the increase in yield of the ALBI, has severely reduced the margin of safety when it comes to including credit as part of a bond portfolio, and we would be cautious on adding credit assets at current levels.
Cyclical economic factors are supportive of bond yields. Inflation should remain benign and growth subdued, which will allow an easing in policy rates. However, persistently low growth and the need for further support of SOEs will weigh heavily on government finances, resulting in wider budget deficits and a significant increase in the debt burden. SAGBs are most likely to exit the Citigroup WGBI in the next 12 months as pressure mounts on Moody’s to move South Africa into subinvestment territory.
The global environment has turned more supportive for emerging markets and for South Africa, however SAGBs have a very limited margin of safety against a turn in global sentiment or a worsening in local economic conditions. Therefore, it is prudent to maintain a neutral to slightly underweight allocation to SAGBs at current levels. Any exposure to South African bonds should be taken in longer-dated SAGBs and shorter-dated ILBs.


Explore Investment Insights on the global economy, markets and topics related to our business.
Subscribe to our Corospondent newsletter