 United States - Institutional


Investment views
Uncharted terrain
Mapping the way forward.
The Quick Take
- Emerging markets are benefiting from falling inflation and policy rates sooner than developed market peers
- However, in SA unique structural issues and strained currency still weigh on recovery, and we are lagging our peers
- Whether the US enters recession or not is the question on every investor’s mind and SA’s economic destiny remains coupled to global events

The past quarter diverged from recent trends in global fixed income, as emerging markets outperformed developed markets. Despite the dollar remaining relatively strong over the quarter, there were select emerging market currencies that outperformed (Brazil and Mexico). The story of the second quarter of 2023 (Q2-23) is, however, one of emerging market yield compression versus developed markets. Many emerging markets are at or very close to the peak in their rate hiking cycles and, with inflation expected to turn quite quickly, these markets have started to price in rate cuts, which has supported their bond markets. Developed markets are definitively on the other end of the spectrum, with inflation still remaining sticky in many economies, interest rates still set to go higher, and bond yields languishing at decade highs. UK bond yields were hit the hardest over the last quarter, selling off close to 100 basis points (bps) versus 20bps-50bps in other developed markets, including the US.
South Africa (SA) has found itself swimming against the stream; but headed in the wrong direction. The rand was down c.6% versus the US dollar and the FTSE/JSE All Bond Index (ALBI) was down c.1.5% over the quarter. The key driver of the poor currency performance was the decline in SA’s terms of trade (-18%) due to the fall in commodity prices and persistent high levels of loadshedding. This had the knock-on effect of dampening the demand for bonds, resulting in bond yields rising c.100bps across the curve. Longer-end bonds were significantly weaker, as bonds with a maturity of greater than 12 years significantly underperformed those with a shorter maturity than seven years (a 2%-3% relative performance differential), due to the expected further fiscal deterioration. Inflation-linked bonds (ILBs) proved the only safe place to hide over the quarter, as they were only down 0.7%, but still lag the ALBI year to date (0.2% versus 1.8%) and over the 12 months (1.2% versus 8.2%). Cash returns are slowly catching up to ALBI returns, outperforming the index over the last quarter with 1.9%, but still lagging bonds at 3.6% year to date and 6.5% over the last 12 months.
MORE OF THE SAME; BUT MORE
SA’s problems are well known and documented. These include slowing growth due to the slothful pace of reform implementation, significant policy uncertainty and a growing debt load, which combine to darken our economic prospects over the medium term. Economic growth is expected to barely make it above 0% this year, with an acceleration to 1.5% next year as the energy constraints start to loosen, but this is still well below the needed 2.5%-3%. Inflation is decelerating but at a much slower pace than previously hoped, which will keep policy rates higher for longer, at or around 8.5%. The fiscal deficit will widen significantly this year to c.6% (including treating Eskom as an expenditure item as opposed to a debt transfer) and will remain there for the next three to four years, with elevated financing costs eating up more than a quarter of collected revenue. This renders the fundamental economic backdrop for SA particularly gloomy.
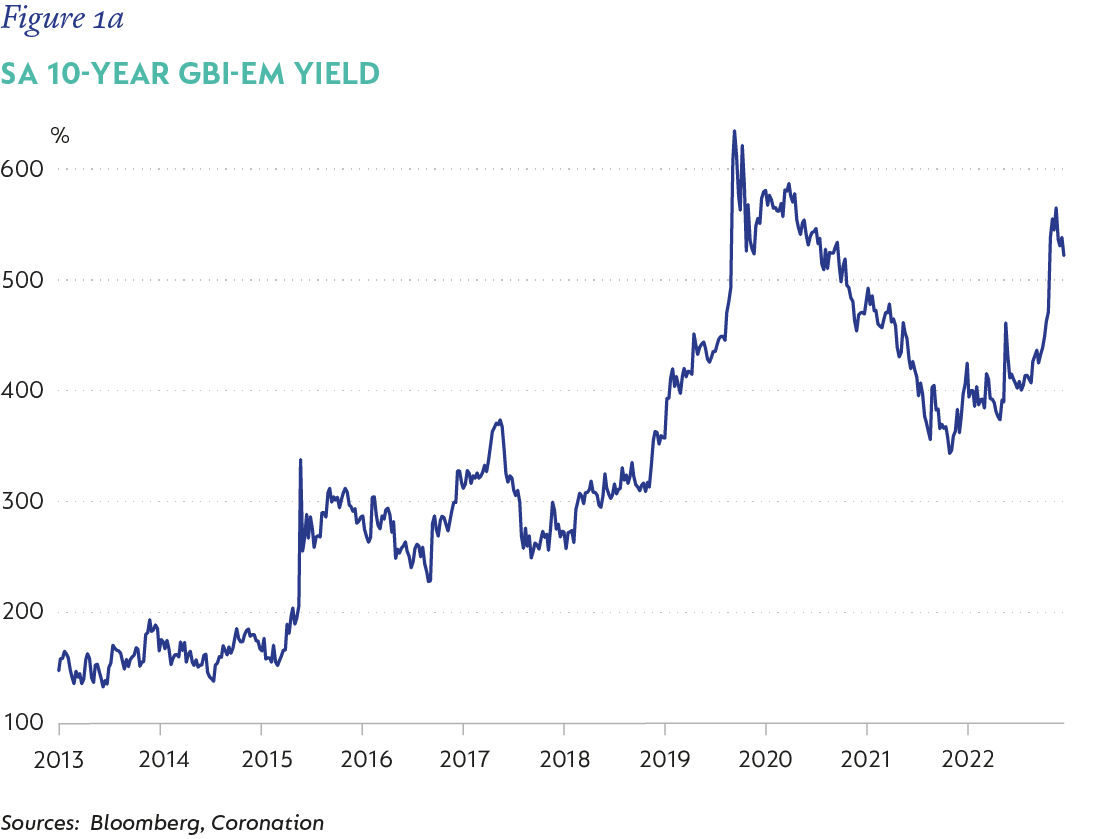
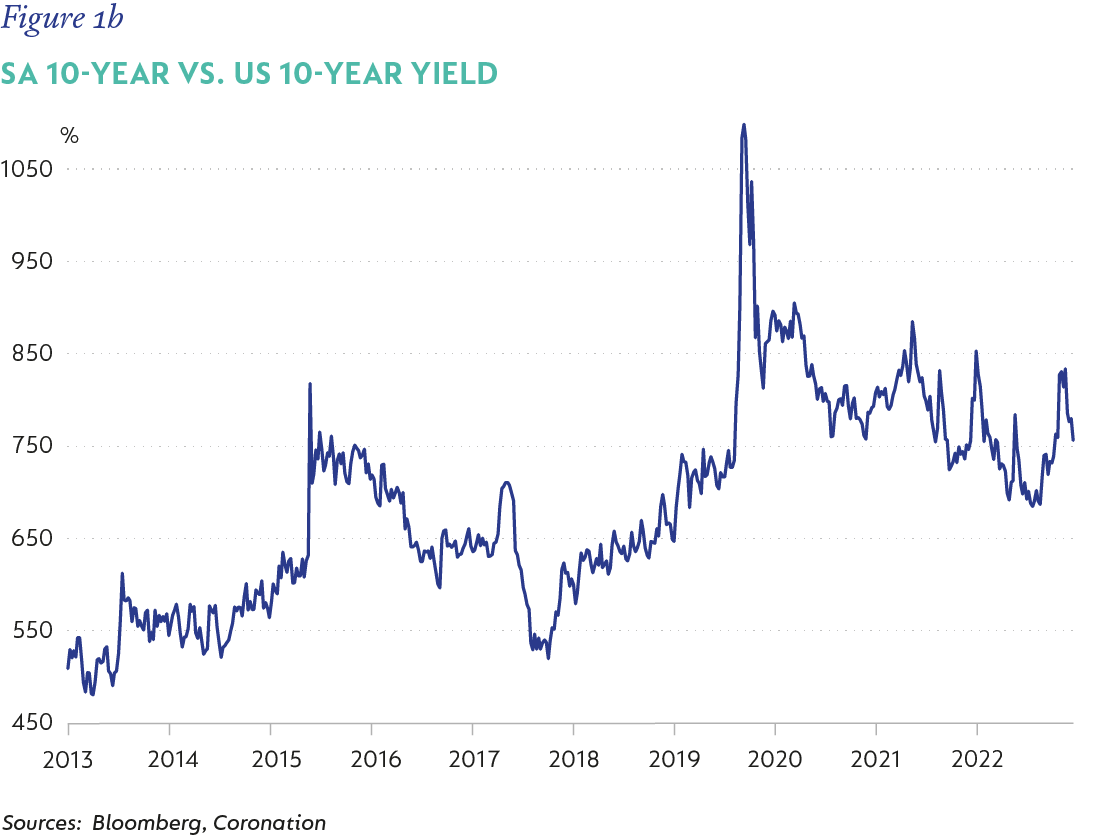
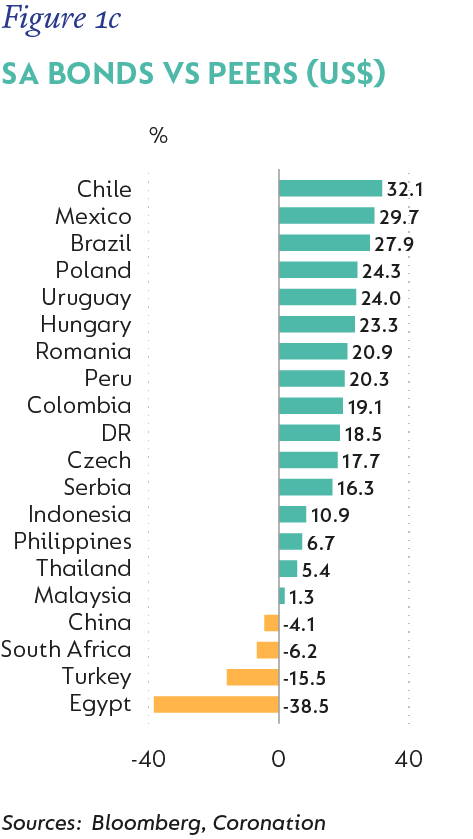
SA assets have tracked this deterioration in the fundamental backdrop and maintained a significant risk premium. Local bond yields have widened significantly relative to their emerging market counterparts (shown versus JP Morgan Government Bond Index-Emerging Markets [GBI-EM Index] yield shown in Figure 1a and developed market yields (shown versus US 10-year T-Bill in Figure 1b). The underperformance against the emerging market peer group is quite stark, as the sell-off in the rand and the rise in bond yields over the last quarter contributed in large part to SA lagging the broader emerging market complex. The degree of underperformance combined with current relative valuations being close to Covid-like levels suggests the risk premium embedded in SA bonds remains compensatory.
 Our assumption that an adequate risk premium is embedded in SA bonds suggests that the direction of local bond yields will be driven by both the direction of global bond yields (more specifically US yields) and movements in the US dollar.
Movements in currency markets are inherently difficult to forecast over the shorter term. Over the medium to longer term, relative interest rate expectations and starting valuations provide a reasonable barometer for where the balance of probability lies for future currency moves.
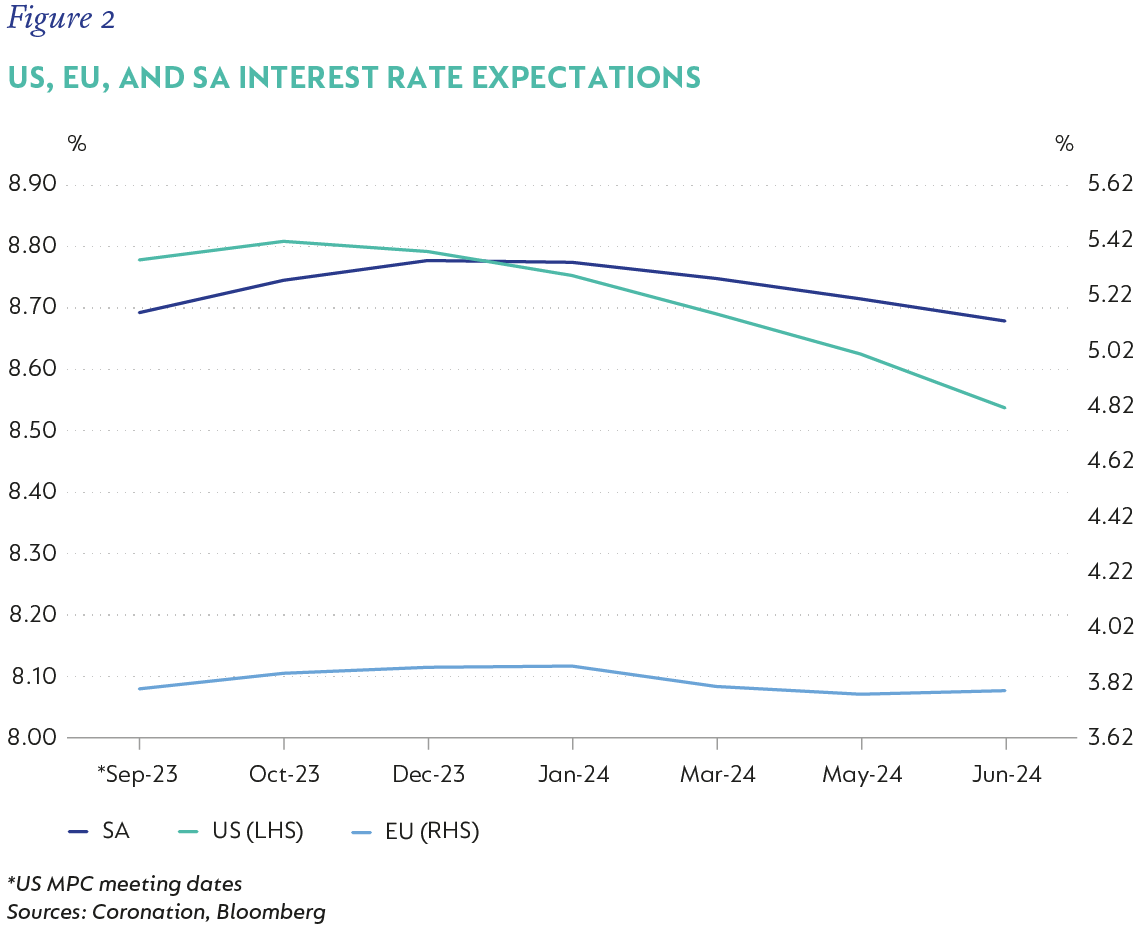
In Figure 2, we show the interest rate expectations for the US, EU and SA. The clear outlier here is the US, where interest rate cuts are being priced over the next year, while in the EU and SA rates are expected to remain pretty stable over the same period, but at elevated levels. This suggests that interest rate differentials between the US and the EU/SA will contract, working against the attractiveness of the US dollar. That is, the interest compensation for the US dollar will reduce relative to the EU and SA.
PROSPECTS FOR THE US DOLLAR
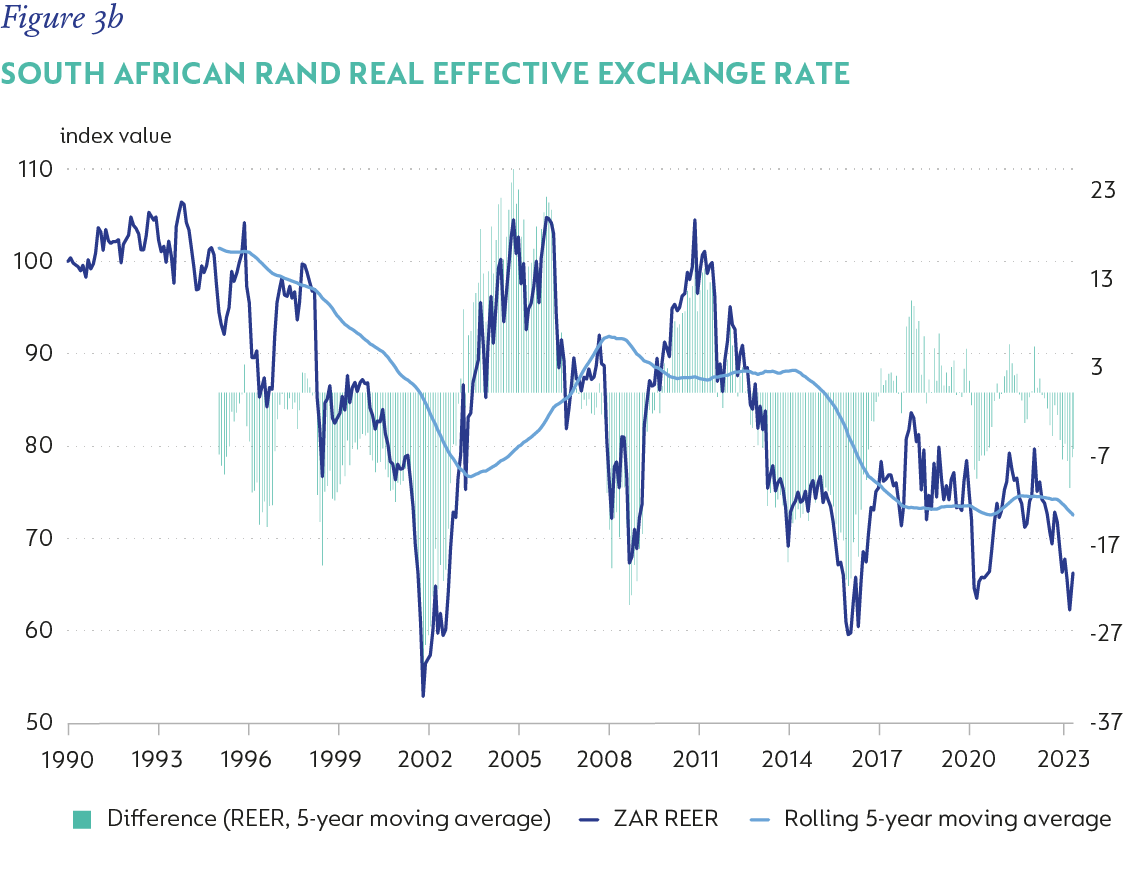
The real effective exchange rate (REER) compares a nation’s currency value against the weighted average of the currencies of its major trading partners. An increasing REER indicates that a country is losing its relative competitive edge and vice versa. When one compares the REER to its own long-term rolling average (five years used below), it provides an indication of the degree of over/undervaluation. In Figures 3a and 3b we show both the rand and US dollar REER’s against their historical rolling five-year averages. In the case of the rand, we can see some level of undervaluation but not as significant as it was in previous episodes of undervaluation; so, it’s probably fair to assume it is only slightly cheap relative to its long-term fair value. The US dollar on the other hand, is notably overvalued, not as extreme as in previous episodes, but definitely stretched.
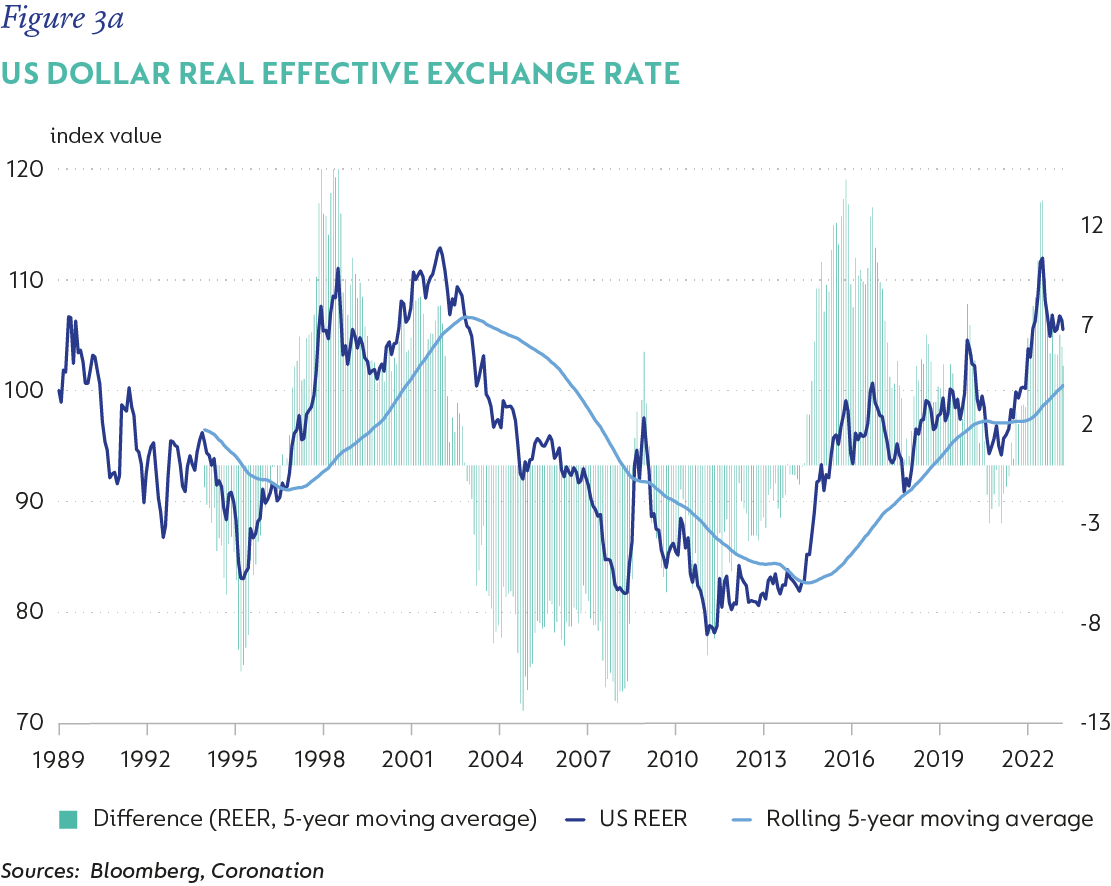
The combination of a less favourable interest rate differential between the US and the rest of the world over the next 12 months and a starting position of significantly overvalued currency suggests that the US dollar is close to or at its peak, putting the balance of probability in favour of a weakening dollar over the next 12 months.
A US RECESSION IS NOT ALL BAD NEWS
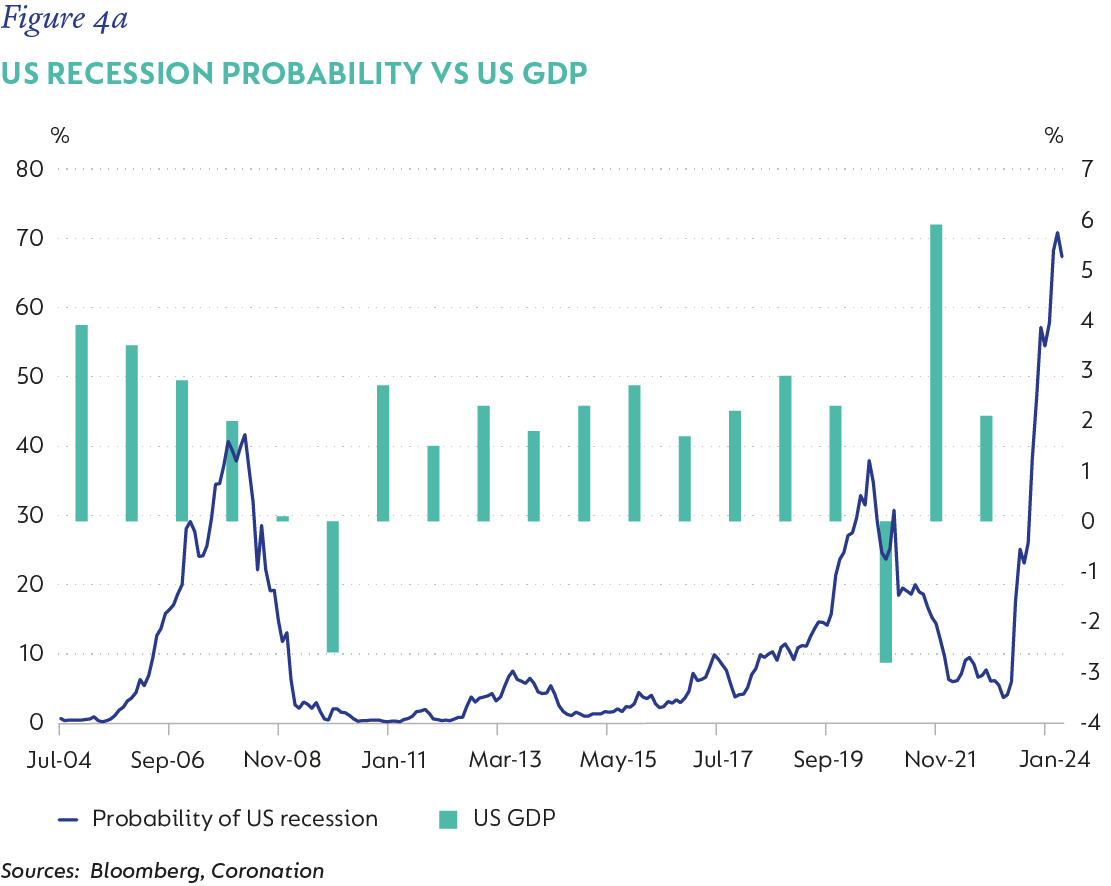
A US recession or the probability thereof over the next 12 months continues to dominate investment debate. Given the rise in short-term interest rates and the tightening in bank lending standards, it is very likely that the US will enter a recession. However, due to the enduring strength in the labour market, the depth and duration of the recession might prove less grave than previous experience.
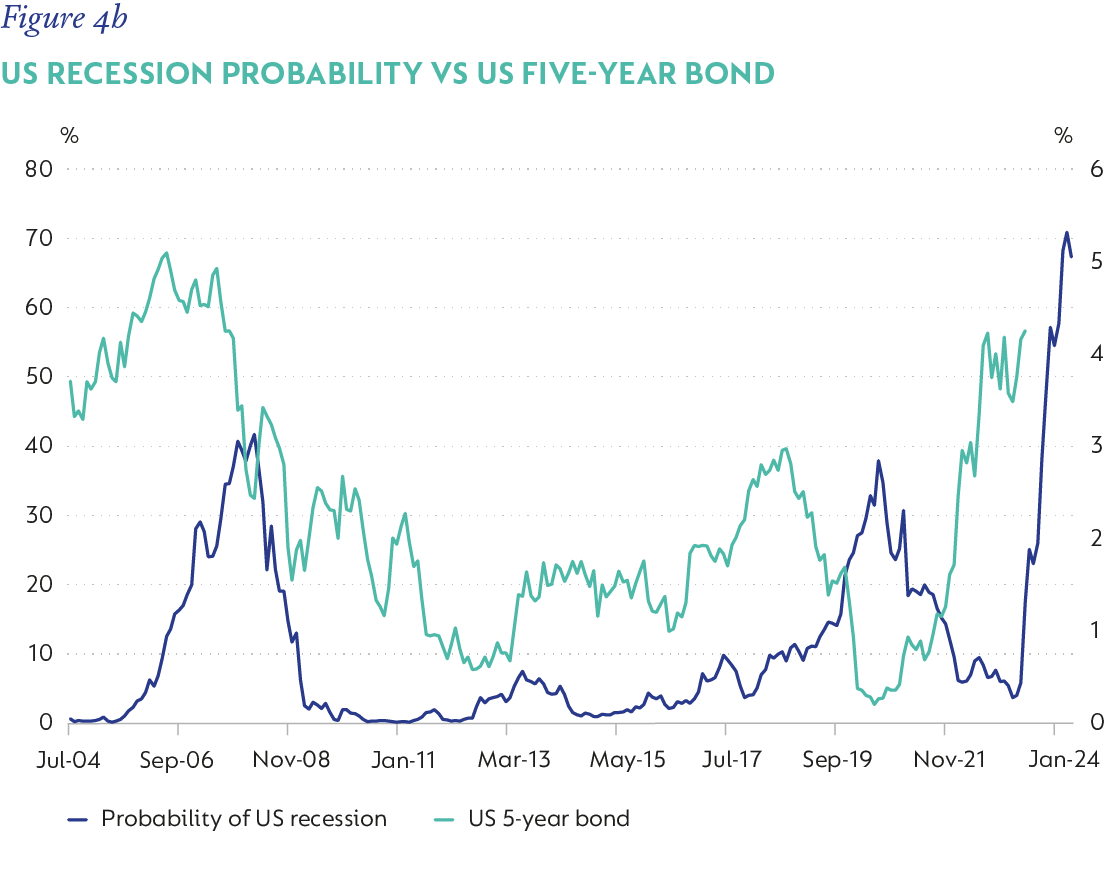
In Figures 4a and 4b we show the Federal Reserve Board of New York’s probability of recession indicator against both US GDP year on year (y/y) and the US five-year treasury note. The first point to make is that in all previous occasions that the indicator was above 30%, the US did go into recession in the following 12 months and that recession saw an annual contraction in GDP of 2%-3%. The indicator is currently suggesting a c.70% probability of recession. The second thing to note is an increase in the probability of recession was accompanied by a fall in five-year US treasury notes, both occurring as the indicator moved higher and as the recession set in.
It is hard to argue that a recession is not imminent and that US yields are not near, if not, at the top of their trading range. However, as stated above, we do not believe the severity of the recession will trigger as significant a risk-off sentiment as was seen during Covid or the Global Financial Crisis.
A high probability of a weaker US dollar, lower US growth, and falling US bond yields make for a very good environment for risk assets, specifically emerging market fixed income assets that enjoy significant carry benefits. SA sits at the top of the pile of the emerging market asset class in terms of valuations due to recent underperformance and stands to benefit – if the view of a more supportive emerging market fixed income environment does materialise, which will benefit SA government bond (SAGB) yields.
OUTLOOK
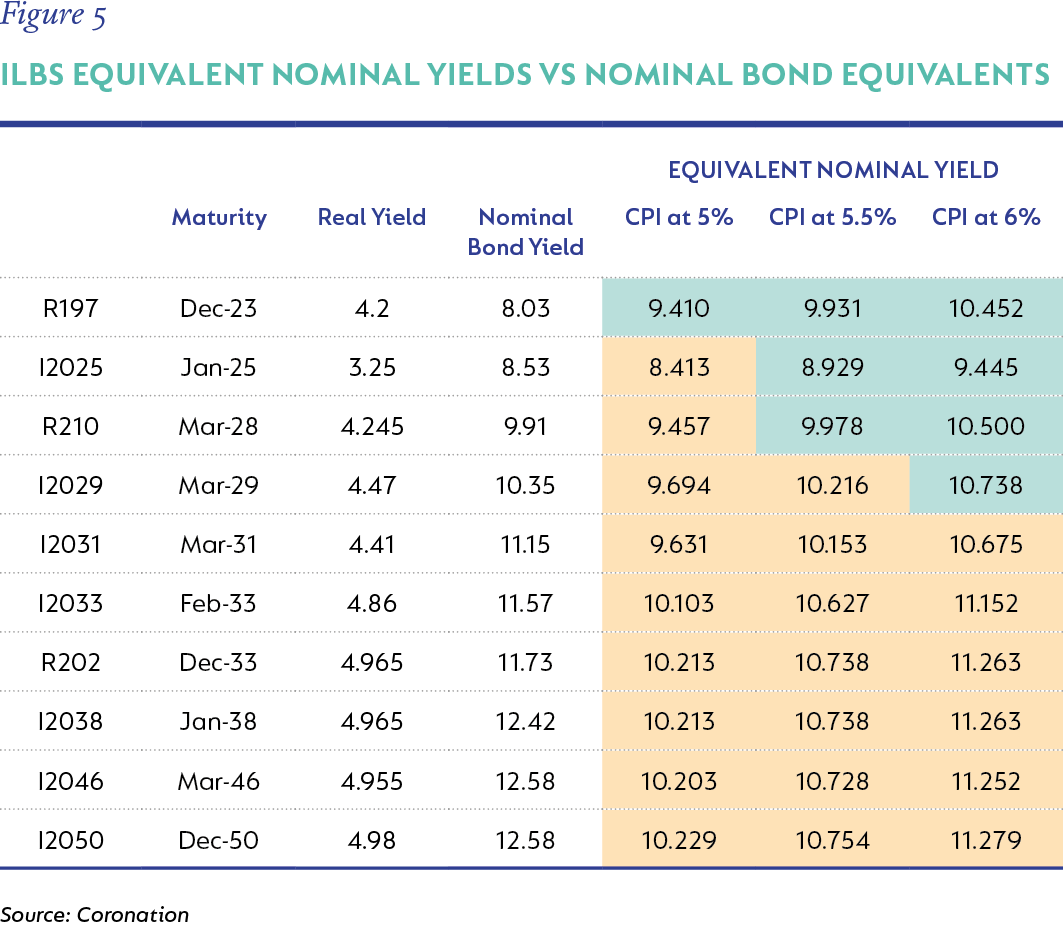
ILBs have enjoyed a strong quarter, as they outperformed nominal bonds significantly, but now, with inflation expectations closer to 5% over the next 12 months and nominal yields remaining elevated, it seems like the tide has turned against ILBs. Figure 5 details ILBs with their equivalent nominal yields versus their nominal bond equivalents. At a 5% inflation level, there appears to be little benefit in holding them, however, as we move towards expectations of 5.5%-6% inflation, value appears in the shorter-dated ILBs (out to 2029 maturity). As a reminder, our expectations are for inflation to decelerate over the next year to an average of 5.5%, but we believe that risks are skewed to the upside due to the longer-term effects of loadshedding on input prices, larger passthrough due to higher prices in source markets, and a weaker rand. As such, we still believe there is merit in holding ILBs with a maturity of 2029 (or shorter) in bond portfolios, due to the inherent protection they offer against the potential of sticky or higher-than-expected inflation.
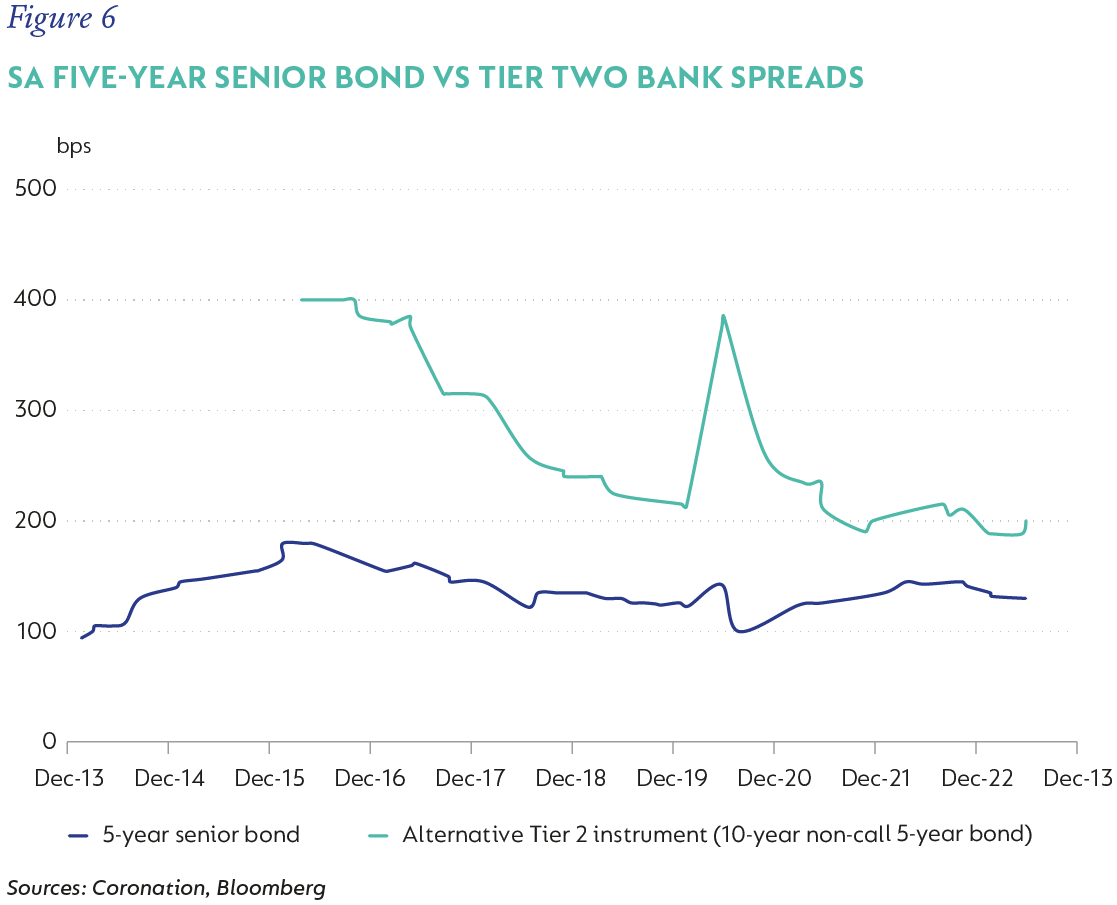
Credit markets have remained relatively subdued. Net issuance this year has been a paltry R1.8 billion, with most of the issuance on the back of refinancing maturing bank-senior and subordinated debt. Despite the poor fundamental backdrop in SA, credit spreads have continued to tighten this year as net supply has dwindled. Senior bank credit has compressed close to 20bps, with five-year paper trading at three-month Jibar+130bps and seven-year paper trading at three-month Jibar+138bps. The compression of term premium in credit spreads is indicative of a market that is hungry for yield at any cost, and not what one would expect in the poor economic environment. Subordinated bank credit (AT1 and AT2) has seen similar compression, with AT2 spreads now just 50bps above senior spreads. As one can see in Figure 6, this compression is quite dramatic and, although banks remain well capitalised and very far from failure, given the nature of the instruments, we feel current pricing to be too optimistic. We view current credit spreads as unattractive, given their current tight valuations and see better alternatives for bond funds in the SAGB nominal and ILB markets.
Despite the better environment for emerging market fixed income over the last quarter, SA has negatively bucked this trend, with an economic outlook that remains plagued by low growth, sticky inflation and an increasing debt burden. In addition, intense levels of loadshedding have shattered consumer and investor confidence in the country’s growth potential and the government’s ability to enact reforms timeously. SA assets have seen a further significant reprice, with bond yields trading close to their Covid wide’s relative to developed and emerging market bond yields. The embedded risk premium remains significant. The move in local bond yields will, in large part, be dictated by global factors. The US dollar and US bond yields are at or near their peak and should provide some support for emerging markets going forward. This should provide some support for local bonds. In addition, we continue to advocate for very little or no allocation to credit in bond portfolios, with instead an allocation to ILBs to protect against higher local inflation.
Disclaimer
SA retail readers
SA institutional readers
Global (ex-US) readers
US readers


Explore Investment Insights on the global economy, markets and topics related to our business.
Subscribe to our Corospondent newsletter