 South Africa - Institutional


Economic views
Eskom: There is light at the end of the tunnel
Coronation’s evaluation of the energy plan concludes that loadshedding can reduce dramatically within four years.
The Quick Take
- President Cyril Ramaphosa’s recent energy announcements can lead to significant positive change but are layered with complexity.
- We interrogated all aspects of the reforms to develop an informed view of how long it may take before we see an end to loadshedding.
- Of significant consideration was understanding the maintenance challenges at Eskom’s current fleet, grid capacity and wheeling agreements.

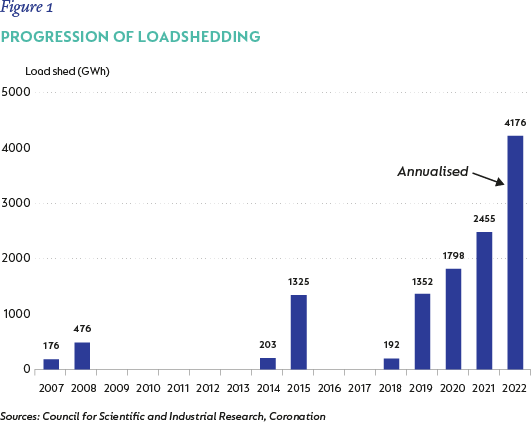
Loadshedding has been a perennial reality for South Africans over the last 15 years, with a significant escalation in the last two years. Although the country has persevered through this reality, the economic toll has been significant.
To gauge the cost, consider that for every 1% of electricity sales Eskom loses due to loadshedding, GDP growth decreases by 0.4%[1]. Eskom lost on average 1% of sales each year for the previous three years and if loadshedding continues at its current rate, the utility will lose around 2% of sales this year.
But perhaps the existence of loadshedding is less disappointing than the fact that it has become much worse over the last decade (figure 1).
A strike at the utility in July 2022 exposed the system’s vulnerabilities, forcing Eskom to declare stage 6 loadshedding. This prompted President Cyril Ramaphosa to finally announce significant measures with the aim of putting an end to the ongoing power interruptions.
As with any reform, the levels of complexities are numerous, and these announcements were no exception. At Coronation, we embarked on a detailed research process to understand how these measures would achieve an end to loadshedding - and, more importantly, by when.
The initiatives can be broadly classified into three categories:
- The first set deals with increasing generation capacity in the short term. This primarily involves assisting Eskom in enhancing fleet maintenance, addressing skills shortages, and reducing incidents of theft and sabotage at the utility.
- The second set identifies sources of additional short-term generation capacity. Options include purchasing power from existing independent power producers with excess capacity, importing excess electricity from neighbouring countries and potentially managing demand.
It is important to pause at this point and note that the President specifically mentioned these measures would limit loadshedding, not eliminate it. We agree with this view.
- The last set of announcements aims to add generation capacity in the medium term. This is an ambitious task but ultimately the only permanent solution. We need to focus our attention on these measures, which include:
- Removing the capacity limit on private generation and working with the private sector to bring on close to 6000MW[2] of privately developed projects. This is no small feat.
- Expediting the close of REIPP[3] bid window 5 and expanding the capacity of REIPP bid window 6, which could contribute an additional 7800MW in total.
- A commitment to look at all legislative and regulatory hurdles which may act as an impediment.
- Finally, and critically, the recognition that the transmission grid needs to be strengthened to support the additional capacity.
We interrogated the implications of these measures to develop an informed view of how and when loadshedding can end. The most significant considerations that informed our forecast are outlined below.
LEGISLATIVE CONSIDERATIONS
During the construction phase, power stations must comply with several regulations such as environmental impact assessments, localization requirements, grid compliance certificates and registration with NERSA. The National Energy Crisis Committee estimated the full regulatory approvals were taking a minimum of 350 days – and this before the first brick had even been laid! The establishment of a one-stop shop to help developers navigate the regulatory obstacle course is a positive step that will go a long way towards accelerating the construction of new power plants.
GRID AND PRICING MODEL
After construction, a power station must be connected to the transmission grid, and here further complexities arise. It is often not feasible for power stations to be developed to produce the exact capacity required and to be constructed directly next to the machinery or plant that will consume the electricity. In addition, renewable energy is often the most cost-effective form of generation, but these power stations are not guaranteed to operate 24 hours a day. It is, therefore, likely that private developers will build larger plants in multiple locations to mitigate the risk of insufficient capacity. These projects will, however, need to rely on firstly a stable transmission grid and, secondly a transparent transmission pricing model which will need to be set by the grid operator.
The first point creates some cause for concern. There is no doubt that like Eskom’s generation fleet, the transmission grid has also been heavily underinvested. Recently, Eskom stated that it will require around R130bn to invest in transmission capacity before 2030[4]. A delicate balancing act needs to be performed: additional capacity has to be brought online, and at the same time the grid needs to be strengthened to support the additional capacity.
The second point unfortunately carries more complexity. The entire grid is state owned in some form or another, either by Eskom or municipalities (and the president was firm in stating that it would remain so). Wheeling[5] through the Eskom grid is a relatively straightforward process and many of the private projects which are currently being explored are able to connect directly to the Eskom grid.
Wheeling through the municipal grids is, however, a different story. Municipalities have the constitutional right to govern the supply of electricity through their boundaries and collect revenue for the provision of this service. While this seems simple, no framework governs how municipalities set wheeling tariffs and it is unknown whether all municipalities have the skill set to do this on their own. With electricity currently making up around 26% of municipal revenues[6], and many municipalities in the country struggling financially, individual negotiations could prove very difficult for electricity producers and their clients. These constraints limit the generation capacity that can be brought online and were, therefore, taken into account in our forecasts.
ALL POWER PLANTS ARE NOT EQUAL
To refine our forecasts further, we considered the nature of the announced generation capacity. Most will be from renewable sources (wind turbines and solar PV) and given that the wind does not always blow and the sun does not always shine, the plants typically only operate at load factors[7] of between 25% to 35%. By comparison, coal plants should, when properly maintained, operate closer to 70% (and at such a number are termed “baseload” technology). All things equal, and given the load factors above, one would require 2.33MW[8] of renewable capacity for every 1 MW of baseload. Alternatively, renewable technologies can be partnered with battery or gas technology to help improve their load factors. We, therefore, adjusted the nominal capacity expectations for the respective load factors of the underlying technologies to determine the effective megawatts that we expect to come online.
RETIRING OLD POWER PLANTS
Furthermore, we considered the decommissioning schedule of Eskom’s existing coal fleet. At an average age of 41 years, the coal fleet is old (excluding Medupi and Kusile), and Eskom will need to retire approximately 20% (11000MW) of its current installed capacity over the next eight years. This means that all things being equal, our current supply deficit will likely increase over the next few years.
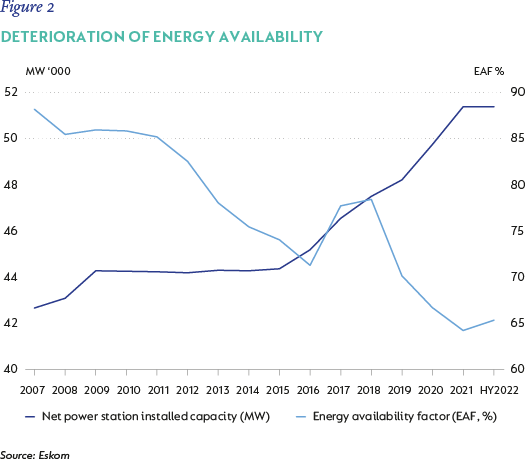
ENERGY AVAILABILITY
Despite building two of the world’s largest coal-fired power stations, Medupi and Kusile (9600MW in total), loadshedding got worse over the last decade and a half. This is partly due to delays in bringing Medupi and Kusile online, but the biggest issue has been the deterioration in Eskom’s plant performance due to the age of their coal fleet and the challenges in maintaining it. Eskom increased nominal capacity, but the amount of time that power plants can produce electricity – the energy availability factor (EAF) in figure 2 – deteriorated.
THREE FUTURE SCENARIOS
Taking into consideration all of the above as well as various additional factors (all reflected in figure 3) that could enhance or detract from the plan to end loadshedding, we mapped out the effective megawatts which we expect to come online over the next few years, overlaying some of our own judgement informed by our research. This is represented by the stacked area chart in figure 3. We then compared this to the effective megawatts by which the electricity system is currently in deficit (represented by the dotted lines). The intersections of the dotted lines and stacked area indicate a balanced system and, in theory, the point from which one can consider the chance of loadshedding to be dramatically reduced. Given the complexity that surrounds such forecasts, we chose to present various scenarios with different assumptions.
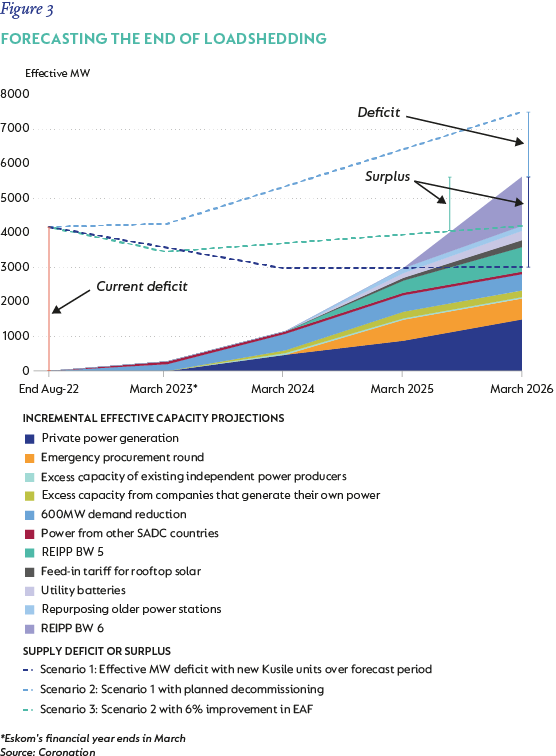
Scenario 1 (blue dotted line in figure 3) shows the effective supply deficit as stated by Eskom, and how it is expected to evolve into a small surplus should nothing change (except the addition of the expected additional Kusile units). Realistically, however, the supply deficit is likely to change, as Eskom will need to retire some of its fleet.
Scenario 2 (light blue dotted line) expands on Scenario 1 by considering the implications if Eskom proceeds with its planned decommissioning schedule and if the energy availability factor does not improve. The result is that a small deficit remains, meaning that although we will not have loadshedding as often as we have currently, it is likely to persist for more than four years. An important caveat in this scenario is that three problematic power stations, Tutuka, Kendal and Duvha, do not appear on the decommissioning schedule over the next five years. However, realistically they are unlikely to last that long.
Finally, Scenario 3 (green dotted line) builds on Scenario 2 by assuming that Eskom improves its energy availability factor by 6% over the forecast horizon. This should result in a small supply surplus.
Based on the outputs of these three scenarios, the analysis suggests that loadshedding is likely to continue for another three to four years.
In the analysis above, electricity demand was assumed to stay constant over the forecast period. In the scenarios where a surplus exists at the end of the forecast, demand growth could theoretically be accommodated. We also took into account the fact that announcements of this magnitude take time to implement. The legislative changes need to be made, business cases need to be finalized, and REIPP bid windows 5 and 6 need to reach financial close. This will likely happen over the next year. Construction will take another 18 to 24 months and only then will new plants be operational.
Our research concluded that the recent energy announcements can end loadshedding within a few years if all parties execute initiatives timeously. The National Energy Crisis Committee and Operation Vulindlela, which is aimed at fast-tracking the delivery of structural economic reforms, are well positioned to oversee and steer the process. Ultimately, however, this will be a broader government effort. There is light at the end of the tunnel, but we still have a long, dark road ahead of us.
[1] Nova Economics study, in constant 2020 prices
[2] SARB
[3] Renewable Energy Independent Power Producers
[4] Eskom presentation, July 2022
[5] Synonym for transmission: The delivery of energy from a generator to an end-user located in another area using an existing distribution or transmission network
[6] Statistics South Africa and Coronation research
[7] Ratio of the actual energy output over a given period, to the theoretical maximum energy output over the same period
[8] 1 MW x 0.7/0.3 = 2.33MW
Disclaimers
SA retail readers
SA institutional readers
Global (ex-US) readers
US readers

Explore Investment Insights on the global economy, markets and topics related to our business.
Subscribe to our Corospondent newsletter