 South Africa - Personal

Investment views
Bond outlook - SA’s fiscal position remains on shaky ground
But bond yields continue to make up for underlying risks
- Global investor sentiment turns negative on the back of China activities
- Bonds came off steeply around the world, with SA at the forefront of the decline
- Policy reform and complexity continues to weigh on SA’s recovery
- US set to taper stimulus package into H2-22, providing ample warning

THE POST-PANDEMIC RECOVERY has been fraught with numerous challenges. Vaccination rates among developed economies remain high and continued economic stimulus has increased demand for finished goods in these countries. However, global supply chains remain slow as emerging economies, which are vaccinating at a much slower rate, are acting as bottlenecks within the global supply chain. Although these bottlenecks might well prove to be temporary, they have resulted in a spike in global goods prices, elevating global energy prices and causing a few sparks in the inflation tinder box. China’s definitive move to redistribute wealth and deflate its property market towards the end of the third quarter of 2021 (Q3-21) increased uncertainty in global markets, further hurting already fragile sentiment and pushing risk assets weaker.
South Africa (SA) was among the worst performers within emerging markets, as the rand lost 5.2% against the dollar (two thirds of which was in September alone) and the benchmark bond widened by 40 basis points (bps) over the quarter (close to 50bps wider from the start of September). The FTSE/JSE All Bond Index was down 2.1% over September, bringing its return for the quarter to 0.37% and 12.46% over the last 12 months. Inflation-linked bonds (ILBs) performed significantly better as real yields held, despite the selloff in nominal bonds, putting their return for the quarter at 2% and 15.76% over the last 12 months. Global bond yields have also seen a significant move wider, with the FTSE World Government Bond Index down 2.26% over the month, led primarily by the move wider in US bond yields (up 50bps from their quarter lows). The pace of the selloff has, in part, also contributed to the weaker risk backdrop for emerging markets.
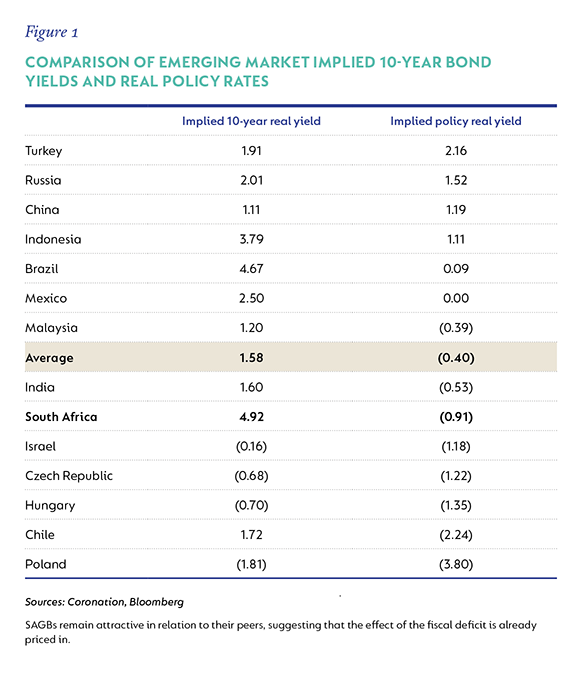
Locally, monetary policy is in the enviable position of being supportive of SA’s growth recovery. Most major developing economies have already started (in some cases they are close to finished) their rate normalisation process. SA government bonds (SAGBs) are still the most attractive emerging market bonds due to their high implied real yield, but SA policy rates remain quite negative, below the emerging market average and in deeply accommodative territory (Figure 1). This has raised concerns about the South African Reserve Bank (SARB) falling behind the inflation curve and has contributed towards the poor sentiment towards SA assets.
LOCAL INFLATION BREAKS FROM PEERS
SA’s inflation outlook is considerably different relative to its emerging market counterparts, due in large part to very little demand-side pressure or credit extension. Inflation is expected to remain close to the midpoint of the target band over the medium term, hence lessening the pressure on the SARB to increase rates aggressively in the short term. However, to keep inflation expectations under control, reduce the need to hike rates aggressively later and provide policy room to react if a crisis does rear its head again, it will likely start the process of gradual monetary policy normalisation by the end of 2021. In addition to a gradual approach to hiking rates, policy rates are expected to peak at much lower levels than in previous cycles. Our expectations are for a gradual rise in the repo rate to between 5.5% and 6% by 2023/24.
BAD WEATHER AHEAD?
The clouds of SA’s precarious fiscal position continue to darken the outlook for the local economy. The cyclical tailwinds from strong commodity prices are not going to last forever, and the expenditure pressures continue to mount. The recent revisions to SA’s GDP numbers, combined with the better-than-expected tax revenue for 2021/22, implies a lower starting position for SA’s debt-to-GDP ratio. However, the trajectory of this debt is concerning and more needs to be done to turn this around. Expenditure requirements are only going to increase from here, given the ailing financial health of local State-owned enterprises and municipalities. This places pressure on reform implementation as an accelerant for growth. Although much has been done over the last year to provide the platform for higher growth, the pace of implementation, combined with the lack of State capacity, has meant that longer-term expectations for growth are still anchored at c.1.5% to 2%, quite a way from the 3% to 3.5% required.
Capital expenditure growth and employment, which are key for growth, are challenged by policy complexity and low levels of confidence. The only socially palatable way to avert a debt trap is to accelerate the pace of reforms, simplify policy and implement quickly. This will go a long way to re-instill investor and consumer confidence, which will contribute to a more sustainable and higher growth path. The ship has set sail in the right direction, but the sea is rough, and much courage is needed to stay the course.
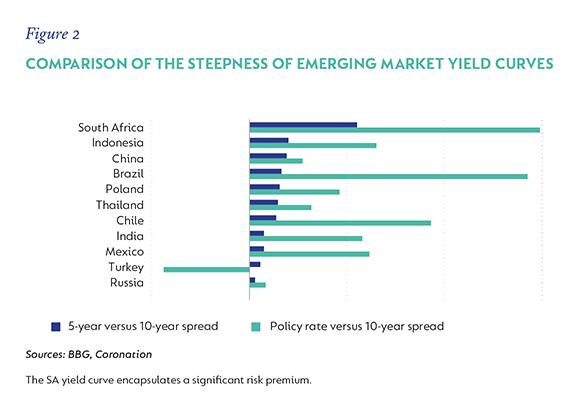
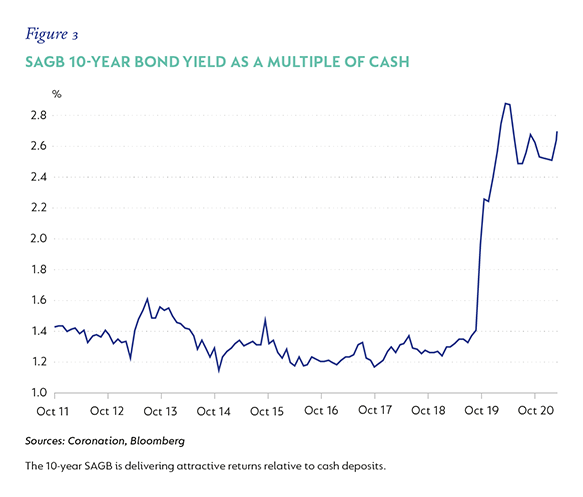
Despite the risk posed by the deterioration in SA’s fiscal position, the valuation for SAGBs remains quite appealing and suggests that a large part of the risk is already reflected in bond yields. While Figure 1 shows how SAGBs still have the highest real yield among the emerging market universe, Figure 2 shows that SA’s yield curve remains the steepest among its peers. This indicates that, from a global perspective, SA still has a relatively high embedded risk premium. The 10-year SAGB trades at close to the highest multiple of cash (Figure 3), meaning that bond yields can sell off more than 100bps before they start to underperform cash.
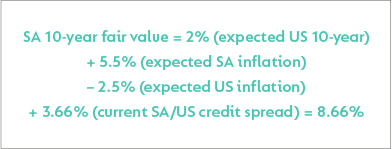
Our fair value estimate for the 10-year SAGB – which uses the US 10-year Treasury note as the risk-free rate, the inflation differential between SA and the US, and SA’s credit risk premium – also suggests there is a significant risk residual in SAGBs.
The fair value equation below compares favourably to current trading levels of 9.70%. This, combined with the evidence presented in figures 1, 2 and 3, leaves us confident that current bond yields reflect adequate compensation for the underlying fundamental risks.
US TO WIND UP STIMULUS
- At its September meeting, the Federal Open Market Committee (FOMC) indicated that it was closer to starting its process of reducing the size of its asset purchase programme by the end of 2021, with tapering to be complete by the second half of 2022. The suggested pace of the reduction is quicker than the market expected; however, this was balanced by increased emphasis on the decoupling of tapering and rate hikes. In 2013, when the Federal Reserve Board (the Fed) reduced its asset purchasing, it injected a huge amount of volatility and uncertainty into market, which caused risk assets to sell off aggressively. This time around, we think a few key things have changed:
- The process of tapering is a more familiar concept than it was in 2013 and much more is known about the process.
- The announcement of tapering in 2013 was a surprise and no forewarning was given. In fact, in the months leading up to that tapering, the Fed had revised its expectations of the long-term neutral rate lower. This time, the Fed has signalled its intentions well in advance, and even when it’s still only thinking about thinking about tapering.
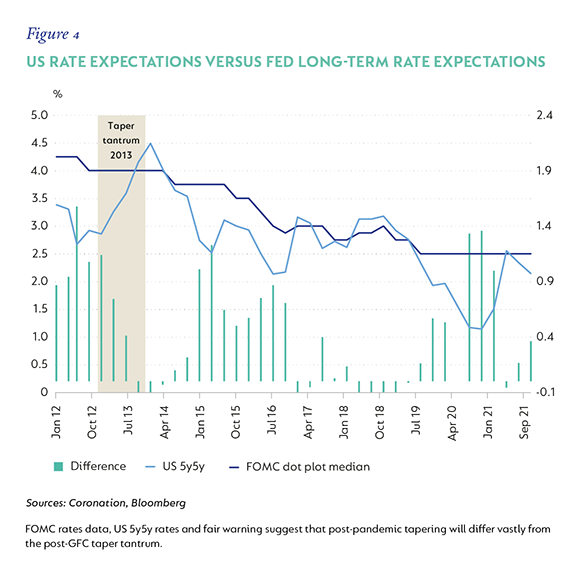
- In 2013, the Fed’s expected long-term neutral rate (as disclosed in its projections) was 4%, yet 5y5y rates (market expectations for five-year rates in five years’ time) were at 2.75%. The Fed also didn’t downplay the risk that policy rates would go higher once tapering ended. This resulted in an aggressive repricing of US 10-year rates to represent long-term expectations. Currently, the Fed has guided to the longer-term policy rate being 2.5% and explicitly decoupled higher policy rates from the end of tapering. In addition, current 5y5y rates are at 2.15%, just marginally below the Fed’s expected long-term neutral rate at 2.5% (Figure 4).
It is for the above reasons that we do not believe that tapering this time around will result in the amount of volatility that was created in 2013, or a large selloff in risk assets. There will, of course, be some volatility around the event and there might in fact be higher volatility, but it won’t be the announcement or start of tapering that would cause it.
REWARD FOR RISK
In previous iterations of this report, we have spoken in detail about the listed credit markets and our view that valuation does not adequately compensate for the underlying risks in most tradable, listed credit instruments. This remains the case. In fact, spreads have continued to compress, making most of the asset class unattractive.
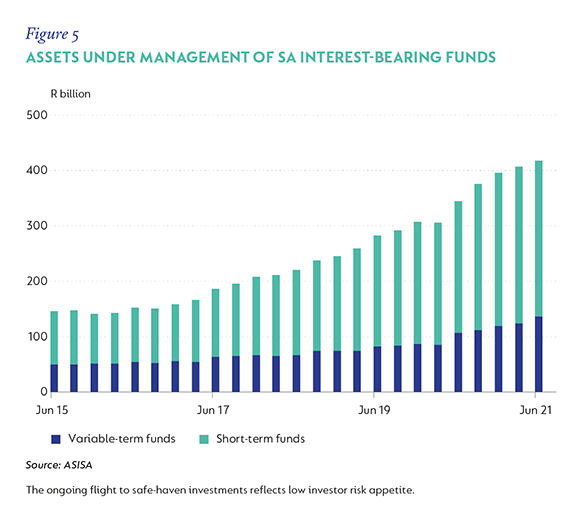
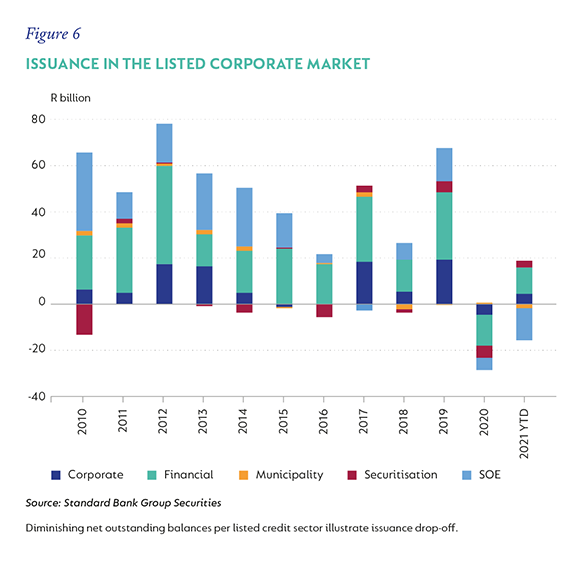
The increased amount of money being allocated to interest-bearing funds (Figure 5), combined with a drop-off in issuance levels in the listed credit market (Figure 6), has exacerbated the supply/demand imbalance. As such, we continue to remain cautious on this asset class.
A new segment of the credit market has presented itself, which we believe warrants investment. Sustainability-linked bonds (SLBs), while a new domestic asset class locally, are well established internationally. Unlike green bonds, which restrict the use of proceeds from the bonds to be invested only in projects linked to environmental, social and governance (ESG) issues, SLBs reward lenders by providing a funding benefit if certain sustainability targets are met within a defined period. This funding benefit is reflected in a tighter credit spread (0.05% to 0.1%) after a specified period, provided that the sustainability targets are met. These targets can be anything from greenhouse gas emissions and photovoltaic capacity to water-use efficiency and green-building certification. Issuance has been small (approximately R3 billion year to date), but this is a segment that will grow. Spreads have been more attractive than those of traditional listed credit, as is generally the case with a young and lesser understood asset class. Coronation has been an anchor investor in this new segment and, provided valuation stays attractive, we will continue to support this segment going forward.
VALUATIONS OUTWEIGH RISKS
As inflation remains under control and growth recovers, local economic recovery should keep on track. While medium-term expectations for inflation remain contained, longer-term expectations for growth are below the level needed to avert continuing concerns of SA being in a debt trap. However, current valuations remain attractive, relative to both local and global alternatives, suggesting that the embedded risk premium is sufficient to compensate for the underlying risks currently. The start of the tapering of the Fed’s asset purchase programme should not inject the same amount of volatility and uncertainty into markets as it did in 2013, and therefore should not have the same negative impact on SAGBs. We continue to view SAGBs in the 10- to 15-year area of the curve as the most attractive asset and advocate overweight positions for bond portfolios.+
Explore Investment Insights on the global economy, markets and topics related to our business.
Subscribe to our Corospondent newsletter