 South Africa - Personal


Investment views
Bond Outlook
No margin for error.
The Quick Take
- Sticky inflation globally is likely to see policy rates at elevated levels for longer than anticipated
- SA inflation also proving hard to tame thanks to the knock-on effects of loadshedding
- SA’s fiscus is under huge pressure as National Treasury walks the deficit line
- ILBs present both investment and protection opportunities in an inflationary world

The relative calm and optimism of the new year quickly evaporated during the first quarter of 2023. Global inflation data proved to be stickier that anticipated in its descent, pushing expectations of monetary policy normalisation higher. The US went from pricing a peak in the US Fed funds rate of 4.9% at the end of January to between 5.5% and 5.75% by end February. This reversed during the month of March, as bank failures in the US and Europe stirred up memories of the 2008/2009 Global Financial Crisis. The tightening in lending standards by the banking sector, specifically second tier banks, which are large lenders in the US economy, is expected to act as a handbrake on demand, putting downward pressure on growth. Global bonds have proven to be the only safe place to hide during this period as yields on US and EU bonds compressed by almost 50 basis points (bps) during the quarter.
South African (SA) bonds lagged their developed and emerging market peers. The rand was down 4.3% over the quarter, making it one of the worst performing emerging market currencies. SA bonds also underperformed, with their spread over US bonds widening by 20bps despite many other emerging markets seeing spreads tightening. The All Bond Index (ALBI) returned 3.4% over the quarter, which was ahead of cash (1.77%), however, over the last year, its return (5.8%) is behind that of cash (6%). Most of the ALBI’s positive return was driven by a change in the shape of the yield curve, with the 7-12 maturities outperforming maturities of more than 12 years, as the latter steepened significantly over the last quarter. Inflation-linked bonds (ILBs) have continued to lag the performance of the ALBI and cash over the last quarter (0.94%) and year (4.92%). This has been predominantly due to a move higher in real yields in sympathy with nominal bonds and reduced inflation accrual as inflation has been heading lower.
A TWIN BURDEN
Global inflation has proven to be stickier primarily due to strong demand and job growth in the developed world. In SA, inflation is also proving to be stickier but for different reasons. The effect of loadshedding on the economy is feeding through to inflation in two ways. First, the tariff increase of c.18% for this year, means that inflation will again kick up to above 6% in the second half of this year. Second, loadshedding not only hampers company profitably due to reduced trading hours, but it also increases costs due to the need for alternative power generation methods (diesel for generators, solar panels, inverters, etc.). This cost increase would not be severe if it was isolated to a single industry, as it would probably be absorbed by margins. However, due to the broad-based nature of this cost increase, it will be passed onto the consumer through raising prices. The result is a significantly deteriorated inflation profile with inflation averaging 6% (6.2% in 2023 and 5.8% in 2024) until the end of 2024, which is about 0.5% higher than our previous forecasts.
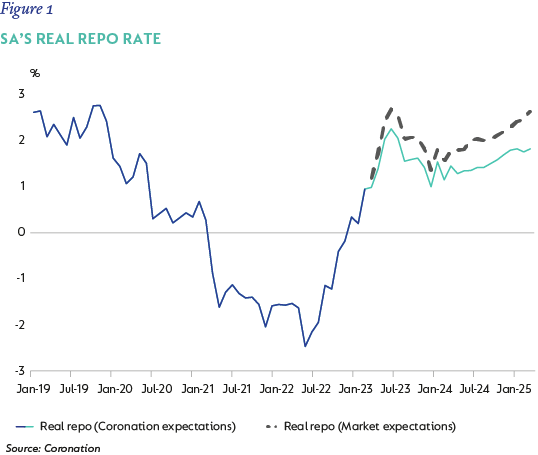
The South African Reserve Bank (SARB) raised interest rates by more than expected at the March Monetary Policy Committee meeting, taking the repo rate to 7.75%, as a direct result of the deterioration in their own inflation forecast. Risks are tilted towards further increases, however, with the real repo rate now firmly in positive territory (+1.2%) and expected to increase towards 2% for most of the forecast period (Figure 1), the SARB might find it difficult to implement significant repo rate increases, especially considering growth expectations for this year remain close to 0% and c.1.5% for 2024. The repo rate is most likely at or very close to its peak.
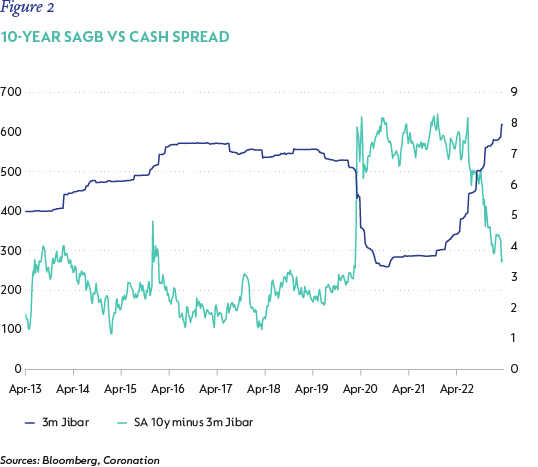
SA bonds have traded at a significant yield differential to cash rates and since the start of the hiking cycle, this spread has steadily compressed absorbing a large part of the rise in short-term rates. At current levels, although, the 10-year SA government bond (SAGB) spread to cash has compressed (Figure 2), it still has a significant buffer to absorb further minor increases in the repo (cash) rates. As such, the effect of elevated inflation and cash rates should be quite muted going forward.
BLOOD FROM STONE?
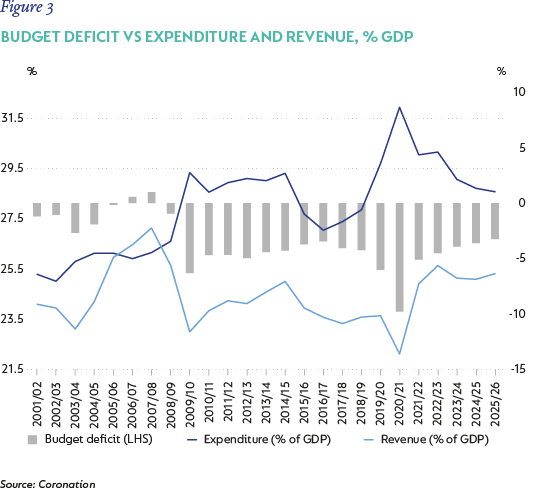
The ailing fiscus remains the biggest risk to the SA economy. At face value, the February 2023 Budget suggested quite a contraction in the budget deficit over the next three years, but it left investors with more questions than comfort. Firstly, the treatment of the Eskom bailout package was not seen as an expenditure item, despite the bailout taking the form of yearly injections rather than an actual debt transfer – which is essentially expensing it. If this is treated as an expenditure item, then this adds c.1% of GDP to the budget deficit forecasts. Figure 3 shows National Treasury’s (Treasury) forecast for the budget deficit, expenditure (% of GDP) and revenue (% of GDP). On the revenue side, despite poorer growth prospects for the local economy due to loadshedding and slow reform progress, Treasury still expects tax revenue to stay higher than it was pre-Covid. Even though over the last two years, revenue was boosted by extraordinary commodity-related profits that are already coming off quite quickly, tax revenue is expected to remain around 25% of GDP, well above its pre-Covid 10-year average of 23.5%. SARS’s efficiency has improved, but not to that extent, as such, it's more likely that this number is closer to 24% of GDP on a sustainable basis.
Expenditure is expected to contract back to its pre-Covid 10-year average of 28.5% of GDP by the end of the forecast period. This might seem realistic but, when one factors in the way that the wage bill was already settled at a cost of 0.5% of GDP and the Social Relief of Distress Grant has not been extended beyond 2022/2023, which could add another 0.5% of GDP to expenditure, slippage from this level seems very likely, with 1% of GDP probably an optimistic outcome.
Assuming 1% of GDP slippage on both revenue and expenditure (remember no provision has been made for further State-owned entity bailouts), one can easily see that the budget deficits are more likely to be around 5% of GDP on an ongoing basis. This number balloons to more than 6% of GDP, if the Eskom bailout is accounted for as part of expenditure. A sustained budget deficit of 5%-6% of GDP is not a good place to be and will increase the pressure on funding. Economic growth of 2%-2.5% is the only way to avert a severe debt crisis in the long term, however, in the short to medium term, there are two release valves.
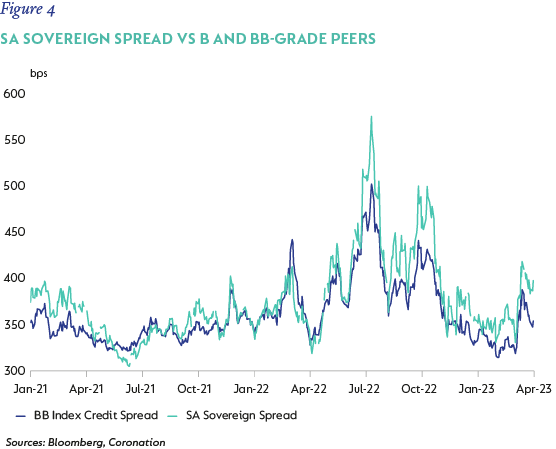
The first of which is Treasury’s funding strategy. SA’s weighted average maturity of outstanding debt is around 11 years, with almost all of it issued in the fixed-rate space. Treasury could easily shorten the maturity of issuance and move it more significantly to floating-rate issuance to decrease the cost of the debt. This will help limit the increase in the cost of debt funding and provide more room for longer-term budget deficit consolidation measures. Secondly, valuations should always compensate for the fundamentals. SA’s credit spread now trades close to its widest levels when compared to its BB-grade (sub investment) peers (Figure 4). This underperformance is more apparent in the last quarter as BB credit spreads have compressed while SA’s credit spread has widened. This suggests the embedded risk premium in the valuation of SA government bonds has adjusted for negative shift in the fiscal outlook.
ILBs are securities designed to help protect investors from inflation. They are indexed to inflation so that the principal and, hence, the interest payments rise and fall with the rate of inflation. Our current inflation forecasts suggest inflation for 2023 will average 6.2% and 5.8% in 2024. These are much stickier than our previous forecasts and with the move higher in real yields over the last 12 months (50bps), ILBs now offer an interesting investment opportunity – both versus their nominal counterparts and for the inherent protection they offer. Figure 5 shows all the ILBs across the maturity spectrum, their real yield, equivalent nominal yields at various levels of inflation and where the similar maturity nominal SAGB trades. The green highlights where the ILB yield is above the nominal yields and the orange the opposite.
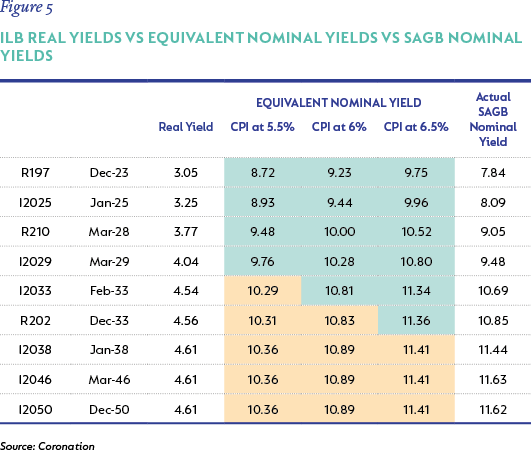
Maturities of less than 10 years (I2033* and shorter) offer an attractive pick up relative to their nominal counterparts and, as such, should be considered to make up a larger part of the bond portfolios, either in addition to current nominal holdings or as a substitute for them.
OUTLOOK
The environment for global fixed income remains unsettled. Thoughts of higher inflation have now been dowsed by concerns that recent bank failures will lead to a larger global growth slide and deep recession. Despite the rally in global fixed income, SA has lagged its emerging market peers significantly given our own idiosyncratic problems with regards to undependable electricity supply and slow pace of reforms. Fiscal risks have escalated amid the façade of consolidation. However, the valuation of SAGBs has adjusted relative to its peer group and still encompasses a significant risk premium. ILBs are now offering significant value given elevated inflation risks and should be incorporated into portfolios as substitutes for or in addition to shorter-dated nominal bond holdings.
*Matures in 2033
Disclaimer
SA retail readers
SA institutional readers
Global (ex-US) readers
US readers


Explore Investment Insights on the global economy, markets and topics related to our business.
Subscribe to our Corospondent newsletter