 South Africa - Personal


Investment views
Bond outlook - Global growth boom spells higher inflation and monetary policy normalisation
But strong local bond performance continues
- SA’s economic and asset price recovery is due to both global developments and local reform progress
- The current global growth and commodity boom raises the risks of higher and more persistent inflation
- The recent unrest is likely to soften, but not derail, a recovery
- Interest rate normalisation will be felt in SAGBs through rising global bond yields and a rising repo rate
- The risk premium embedded in SA bonds should absorb a significant amount of the widening in global bond yields and higher local policy rates

THE WORLD IS poised to experience growth exceeding 6% this year, as many developed market economies make breathtaking recoveries to pre-pandemic levels of output. Emerging economies will lag this growth boom due to less fiscal cushioning during the Covid-19-induced crisis and slower vaccination rollouts, leading to a more gradual economic reopening. The recent rise in commodity prices, spurred by increased demand from China, a pivot towards greener technology and a focus on infrastructure development, has offered salvation to emerging market commodity producers. This growth and commodity boom does, however, raise the risks of higher and more persistent inflation.
South Africa’s (SA) recovery has been elevated by the current global environment, which has translated into strong asset price performance. The rand is up c.3% against the US dollar this year, with most of that performance coming through in the second quarter of the year (Q2-21). This is pretty much in line with its emerging market peer group (except Brazil, which has enjoyed a more significant recovery in its currency following the commencement of its preemptive rate hiking cycle), but what has set SA apart is the performance of its local bonds. Despite the yield on the 10-year bond being 30 to 40 basis points (bps) higher since the beginning of the year, the FTSE/JSE All Bond Index (ALBI) has returned 5% this year (6.9% over Q2-21). This has been led by the strong performance of bonds with a maturity of >12 years, as the yield curve has continued to flatten. Inflation-linked bonds (ILBs) had a poorer quarter, returning c.3%, but remain ahead of ALBI returns, year to date (7.7%). Both ALBI and ILB returns remain well ahead of cash for the quarter (0.88%) and the year (1.73%).
POSITIVE DEVELOPMENTS DRIVING LOCAL RECOVERY
SA’s economic and asset price recovery has not been solely due to global factors. Local developments, including the lifting of the minimum threshold for energy generation licensing to 100 megawatts; the sale of a majority stake in South African Airways to a local consortium; the sidelining of suspended ANC Secretary General, Ace Magashule, following his arrest by the National Prosecuting Authority; and the sentencing of former president Jacob Zuma to 15 months in prison for not testifying at the Zondo Commission, have also helped to improve investor belief in SA’s reform agenda. Inflation has continued to remain well under control, and, although it will hover around 5% for the next 18 months, we do not see a sustained move through the top end of the inflation band (6%).
The recovery in growth this year is supported by the low base in 2020, the bounce in commodity prices, the rebuilding of inventories and a slightly more optimistic consumer. Growth this year will be more than 4% and just above 2% in 2022. As a result, one can expect the next move in interest rates to be higher, although this would most likely only take place at the end of 2021 or in the first quarter of 2022. Higher growth and higher commodity prices imply stronger tax revenue, which provides more breathing space for the fiscus. In addition to this, government has continued to hold the line on the government employee wage freeze, which keeps SA on the path of fiscal consolidation.
Despite the recent recovery in local bond yields and the flattening of the yield curve, SA bond yields remain elevated, and the curve remains steep. In Figure 1, we show the current SA bond curve relative to pre-Covid-19 (June 2019) levels.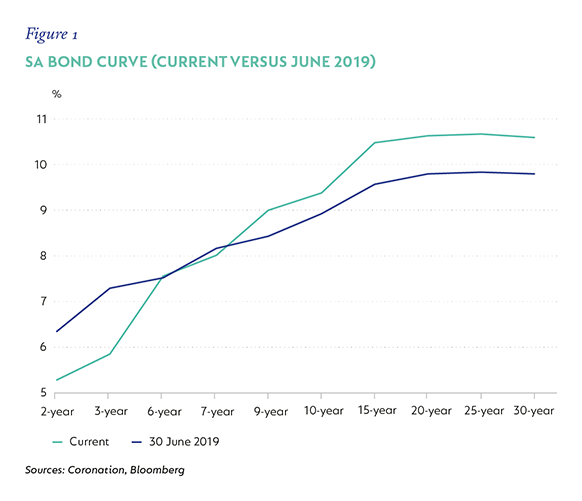
Two things are immediately observable. First, the shape of the curve remains incredibly steep. Arguably, the fiscal metrics in 2019 were better, but expectations were for significant deterioration. Currently, fiscal metrics are at their worst since the Global Financial Crisis, but will improve over the next two years, which suggests the curve should be flatter. Secondly, bonds yields are very elevated compared to cash rates. This is illustrated in the bond breakeven rate relative to cash, which measures how much bond yields can sell off before their return equals cash. Not only are the breakeven rates elevated, but the five- and 10-year bonds have very similar breakevens, suggesting the overall level of bond yields remains very elevated relative to cash and price in a significant risk premium (Figure 2). This suggests that, overall, there is still significant room for bond yields across the curve to compress (reduce) and the spread between longer-dated bonds and shorter-dated bonds to narrow (a flatter yield curve).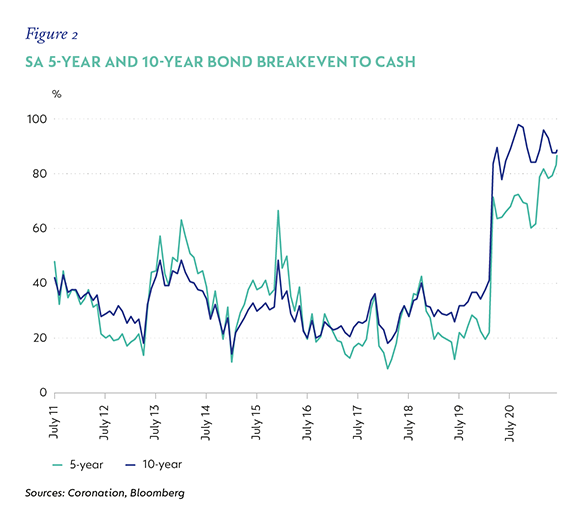
THE EFFECT OF INCREASED RATES
Over the last six months, concerns around rising inflation and excess liquidity in global markets have heightened expectations for interest rate normalisation, both in developed and emerging market economies. The impact of this will be felt in SA government bonds (SAGBs) through rising global bond yields and a rising repo rate.
The current steepness of the bond curve and high bond breakevens relative to cash suggest a limited pass-through of rising short rates (the repo rate) into local bond yields. However, this is not a certainty. All previous episodes of rate hiking in SA have had a knock-on to higher bond yields. The current landscape might just mean that the pass-through is reduced. In a rate hiking cycle, shorter-dated bond yields are generally more sensitive to a change in cash (repo) rates, while longer-dated bond yields have a much lower sensitivity.
In Figure 3, we show the total return of each of the government bonds given a move up in yields over the next two years – e.g. if the R186 yield moves up 2% in the next two years, its total return will be 4.99%. The area shaded in green is where a bond’s performance exceeds the performance of the R186 (five-year) and R2030 (nine-year). The five- and nine-year bonds will generally be more sensitive to movements in the repo rate and will experience a much more significant move higher in yield than the rest of the curve. Only in the case where all bond yields move up by 2% do the 12- and 15-year bonds underperform the five- and nine-year bonds. This reinforces the case for holding bonds in the 12- to 15-year area of the bond curve, as it offers the most attractive return prospects in the event that the repo rate is normalised over the next two years.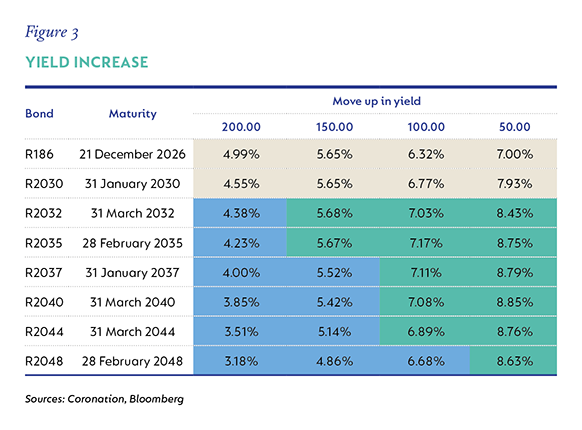
Global monetary policy normalisation will take the form of the tapering of bond asset purchase programmes, followed by a rise in policy rates. This will result in global bond yields moving higher over the next few years. Historically, the pace and magnitude of the rise in global bond yields have had significant repercussions for the local bond market. More specifically, the more sudden and sizeable the selloff in global bond yields, the larger the rise in local bond yields. Currently the US 10-year Treasury Bond (a proxy for global bond yields) is at 1.5%, and pricing in the forward market puts expectations for this rate to be at 2% to 2.25% over the next two to three years. The magnitude of the move is not large by historical standards, although the pace of the repricing will remain unpredictable.
Local bonds have generally had a high beta (the relative measure of volatility between two assets) with US 10-year bonds. However, the spread between SA bonds and US bonds is at historically wide levels, primarily due to the deterioration in SA’s fiscal metrics. It is plausible that with SA’s fiscal metrics recovering, this spread is too wide and should narrow, implying that even if US bonds were to sell off, the equivalent selloff in SA bonds should not be severe. In Figure 4, we look at the rolling two-year beta of SA 10-year bonds to US 10-year bonds, versus the spread between the two bonds. It is quite evident that, as the spread has widened, the beta between the two has decreased; i.e., the influence of US rates on SA rates has diminished. This further suggests that the risk premium embedded in SA bonds should absorb a significant amount of the widening in global bond yields.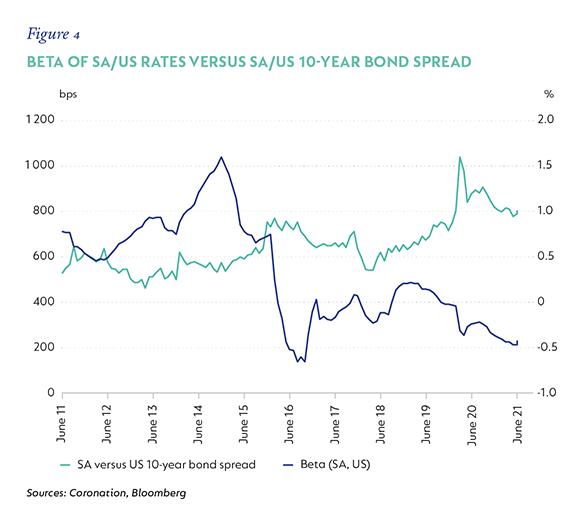
INFLATION PROTECTION A NECESSARY INSURANCE
The rise of inflation has become a hotly debated topic. The surge in demand that we are seeing in developed economies as they open, the supply bottlenecks and elevated commodity prices are all stoking concerns that inflation will exceed current lofty expectations and remain high for an extended period. Our base-case view is that most of these factors are transitory, and that the feed-through to SA will be muted and offset by softer demand conditions locally.
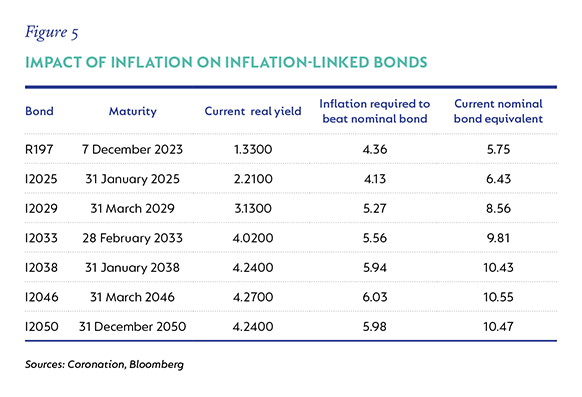
However, in constructing robust portfolios, we must look for assets that provide us with some protection in the event that the tail risk becomes a reality. ILBs provide portfolios with protection in the event that inflation materialises higher than expectations. Currently, the real yields on offer are higher than longer-term averages, and the actual inflation average required to provide a better return than nominal bonds is quite low in certain areas of the curve. Figure 5 shows the various ILBs on offer and the inflation average required over the maturity of the bond to perform in line with its nominal bond equivalent. The longer the maturity of the bond, the larger the payoff symmetry; i.e., if you are certain inflation will average above the minimum required level, it pays more to own the longer maturity. Our current expectations are for inflation to hover around 5% for the next 12 to 15 months, which makes ILBs out to 2029 quite attractive. Longer-dated ILBs will have a better return profile, but the hurdle for them to outperform nominal bonds is significantly higher, making them less attractive
TO CONCLUDE
The prospects for the local economy have improved as reform progress has gathered momentum and global developments have provided tailwinds to the local recovery. Inflation is moving higher, but should remain under control despite uneasiness around global inflation. The recovery in growth should gain more traction and spill into next year, which will provide more breathing space for the fiscus. SAGBs, despite their recovery in the last quarter, still embed a significant risk premium relative to cash. The steepness of the yield curve makes the 12- to 15-year area attractive, even in the event that the local rate hiking cycle starts sooner than expected. For bond portfolios, we continue to advocate overweight positions to SAGBs focused in the 12- to 15-year area of the curve and allocations to ILBs with a maturity of less than eight years.+
Disclaimer


Explore Investment Insights on the global economy, markets and topics related to our business.
Subscribe to our Corospondent newsletter