 South Africa - Personal


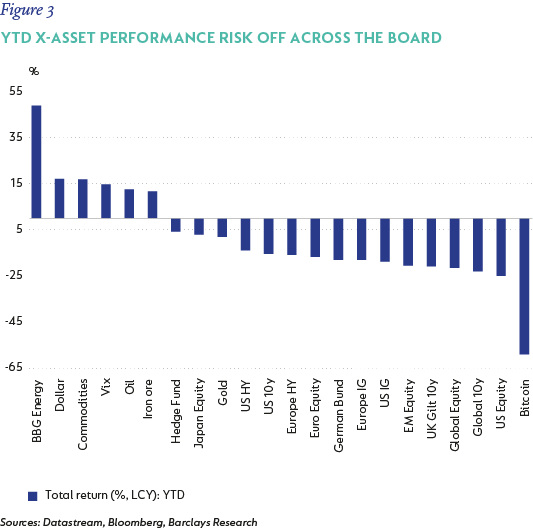
After an initial rally, the rest of the third quarter (Q3-22) continued in a similar vein to the prior quarter with both equities (MSCI All Country World Index down 6.8%) and bonds producing negative returns (Bloomberg Barclays Global Aggregate Bond Index down 6.9%). Again, there were precious few places to hide, with listed property down 12% and gold down 8%. Even oil prices, which had been strong so far this year, declined by 23% in Q3-22. The US dollar outperformed most currencies, with the dollar index strengthening a further 7% - ensuring that even cash held in other currencies delivered a poor return when measured against our reporting currency.
This year has certainly been brutal to investors. To put it into historical context, the following grim facts are worth noting:
- To the end of September, the S&P 500 Index had experienced only three worse first three quarters of a year - in 1974 (recession), 2002 (9/11) and 1931 (the Great Depression).
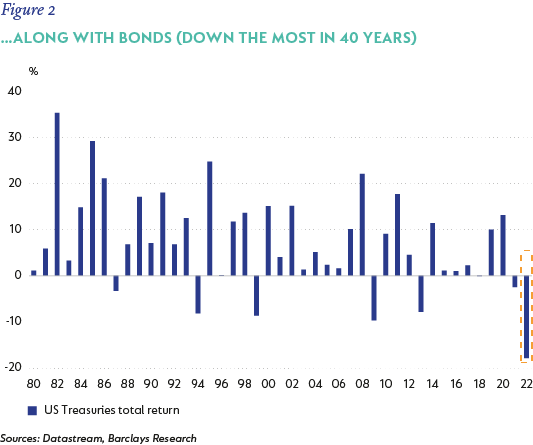
- The rolling 10-year return for global government bonds is now 0% - a decade of returns has been wiped out. This is the worst return since the 1950s.
- If the year were to end at current levels, with both US stocks and bonds in negative territory, it would be only the fourth year ever for this to have occurred simultaneously.
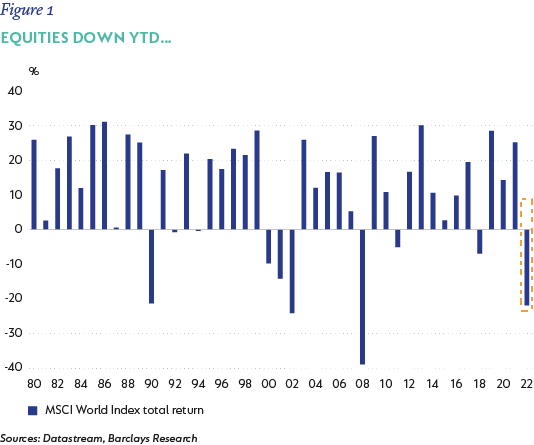
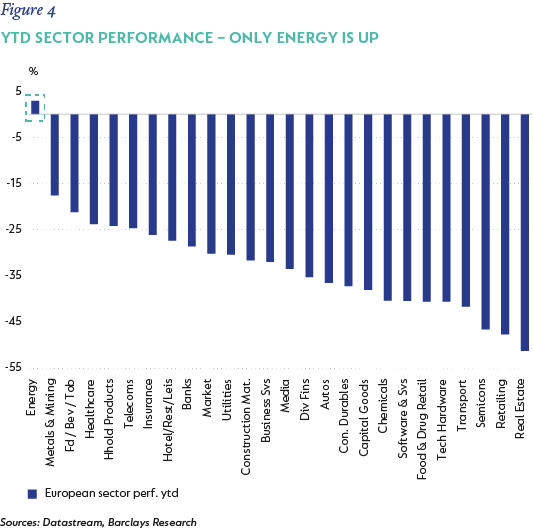
Diversification amongst the traditional asset classes of equity and bonds hasn’t shielded investors, neither has other forms of diversification. Amongst equity sectors, the only positive sector year-to-date is energy. Geographically, not a single developed market has remained positive for the year.
The Fund was not spared, producing a quarterly return of -6.3%, marginally above the 60/40 benchmark (-6.8%).
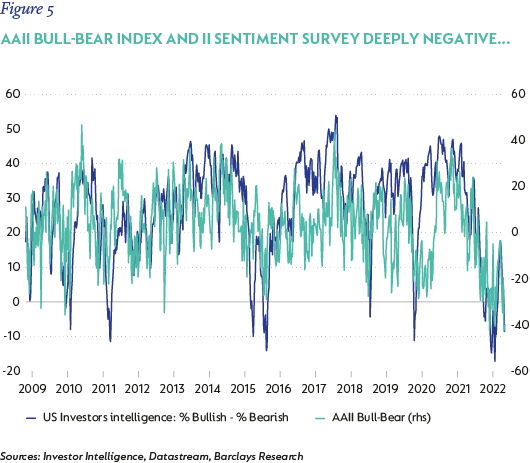
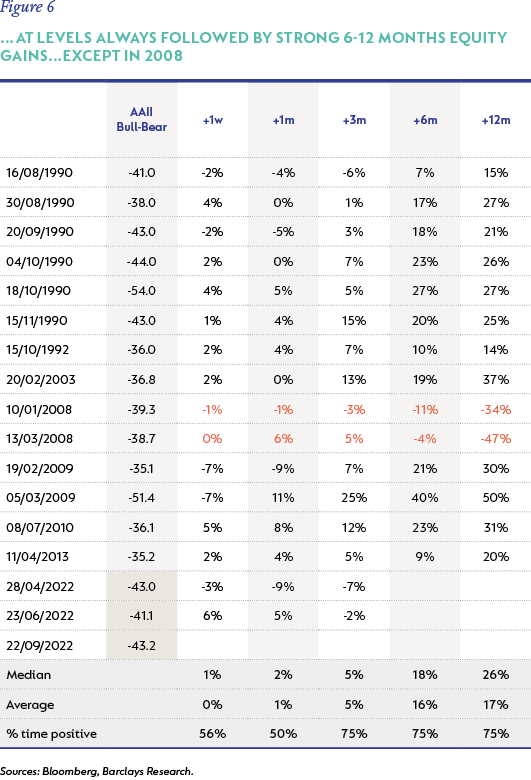
While the severity and somewhat indiscriminate nature of the sell-off has been painful to endure, it has also resulted in widespread price dislocation. In equity markets, for instance, good businesses have been jettisoned alongside weak businesses, with little regard for differences between their long-term prospects. Across multiple industries and investment themes, our analysts are finding a range of opportunities that we consider to be very attractive today. Unsurprisingly, market and consumer sentiment are extremely negative. Historically, this has often been followed by a period of strong returns.
Long-time readers will know that we follow a valuation-driven investment research process. By assessing multiple factors (including the underlying earnings power of a business, the quality of management and key risks), we aim to determine a fair value (FV) - our estimate of what the business is worth. When the market price of a stock is well below our FV estimate, it often signals opportunity. Historically we have found that the more upside our analysts find, the stronger prospective returns are. Today, the upside in the equity portfolio is over 80%, which is well above historical levels and is one of the reasons supporting our optimism about the portfolio’s prospects.
To highlight the broad range of opportunities our analysts see today, we have selected a few examples from different corners of the market – spanning different industries and style factors – where we believe the long-term fundamentals of the businesses are not reflected in the valuation.
(SOME) HIGH QUALITY GROWTH STOCKS ARE VERY CHEAP
Alphabet has many ubiquitous, critical services that people use daily and which simplify their lives. Most people use Google, Alphabet’s largest product by revenue and profit, daily, and even unconsciously, to complete tasks. Businesses use it to attract customers. Including Search, Google now has nine consumer products with over 1 billion users[1] and a large and fast-growing enterprise business, called Google Cloud Platform (GCP).
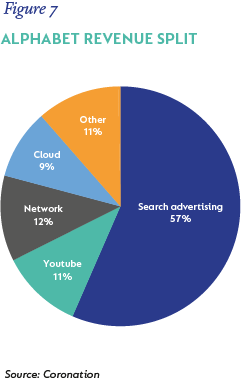
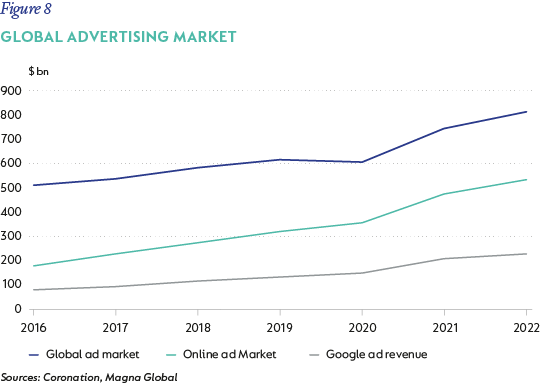
The core search business, Google, remains very strong and the company continues to deliver valuable innovation in this segment. In Q2-22, search revenue grew at 13.5%; however, if one looks at the growth rate since 2019 (to account for the spike in usage during the pandemic), search revenue grew at 20% per annum, faster than it was growing pre-pandemic. Alphabet has been innovating significantly in retail and travel. Retail is Google’s largest search category currently. Sundar Pichai, Alphabet’s CEO, mentioned that two-thirds of search users begin their shopping journey online, regardless of whether they make the final purchase online or in-store. They are working on ways to make the online shopping experience richer by, for example, adding more visual content, and more information and reviews for products as well as services. Underlying this is their artificial-intelligence driven shopping graph which now links to 24 billion product listings. Complex technology sits behind Google Lens, which allows users to take a picture of any product (or other item in the world) to learn more about it. This is effectively visual search and is a fantastic user experience with many use-cases.
Within travel, Google is working hard to improve the experience for consumers, merchants and service providers. They have increased participation of hotels, as opposed to online travel agencies, in travel search results. Google copied its successful retail playbook by allowing free listings and bookings within search results and maps. Google has also made it easier for merchants to update rates and availability, to target consumers with offers and is improving its reporting to merchants. Richer listings help offset the strong position of Booking.com and Expedia, lead to higher conversion of clicks to bookings and, ultimately, better pricing for Alphabet.
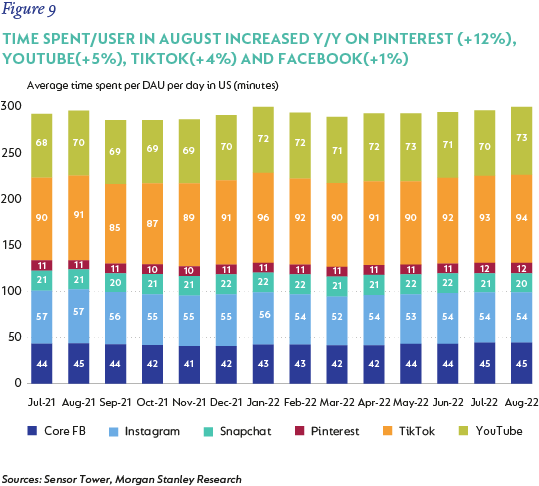
Engagement on YouTube remains strong despite the rise of TikTok. YouTube has launched YouTube Shorts, a short-form video-based service to benefit from the growth of this format. YouTube Shorts already claims 1.5bn monthly active users, a good feat in a small space of time.
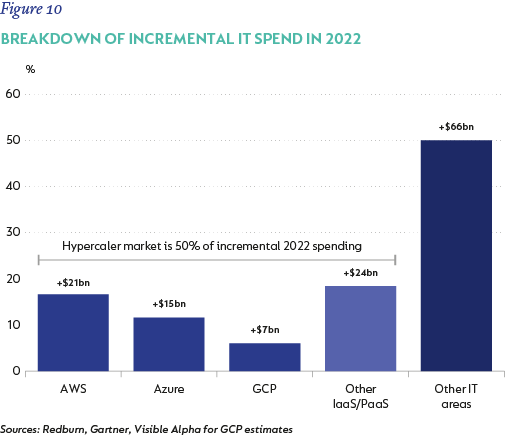
GCP is another Alphabet business we are keenly monitoring. Google Cloud is the third-largest cloud provider globally, with revenue of $19bn last year. It competes with two other behemoths in the space, Amazon (Amazon Web Services had revenue of $62bn in 2021) and Microsoft (Microsoft Azure had revenue of $45bn). GCP’s revenue grew at 35% in Q3-22 and the business is close to break-even.
Alphabet recently acquired Mandiant, one of the leading cybersecurity companies globally outside of CrowdStrike and Microsoft’s security offerings. Cybersecurity has become a critical service for enterprises, given the proliferation of user endpoints (mobiles, tablets, laptop usage at home), which has become much more common since the pandemic. This will support Google Cloud’s enterprise sales strategy which is spearheaded by Thomas Kurian (an ex-Oracle sales head) who has done a commendable job at developing Google’s enterprise sales capability.
The current market dislocation has resulted in Alphabet trading at 17 times earnings if one excludes the net cash on its balance sheet (10% of the market cap). We commend management for spending all free cash flow on buybacks in the first half of the year.
(SOME) CYCLICALS DON’T YET PRICE IN AN IMPROVED OUTLOOK
Commodity producers are generally poor businesses – capital intensive price takers with more than average regulatory risks. They price in the market’s estimate of their future cash flows like other listed companies, but in their case the estimates vary wildly from month to month and day to day – mostly based on spot prices. Cyclical companies are the perfect example of Benjamin Graham’s Mr. Market – oscillating between euphoric and depressed over time.
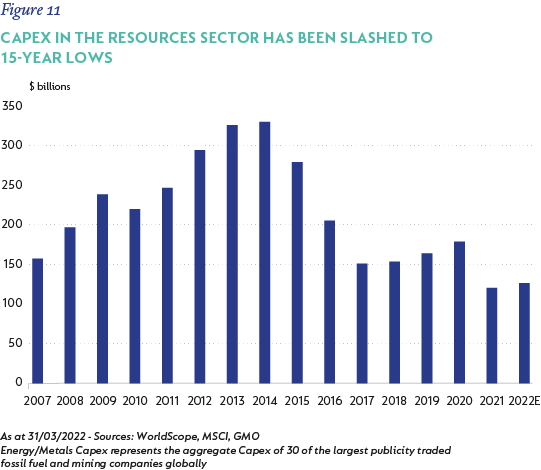
This gives long-term investors the chance to invest in cyclical companies when the market’s perception of value differs from their own – and profit if they are right. We have invested 11% of the Fund in selected oil and gas producers, diversified miners, gold miners and aluminium producers. In addition, we have invested 5% in physical gold. It is easy to be bearish on cyclical companies when the outlook for the global economy is so negative. We believe that in the case of the companies we have selected, the market for their commodities has changed for the better over the past few years, and that this is largely missed by the market. These positive changes mostly relate to the outlook for medium- and long-term supply in the various markets.
In the case of oil and gas, over the past decade, the US was the major source of new production following the success of fracking their shale reserves. The market rewarded the companies with the most growth; this growth was delivered with near complete disregard for cash flow and returns. The oil price collapse as well as bankruptcies and near bankruptcies changed US capital provider attitudes towards cash returns. US shale investments will be far more disciplined in future, while there has been serious underinvestment in all other areas of the world that will need years to address.
The other key change we have seen from the oil industry is the diversion of capital away from fossil fuels to renewable energy. Not only are companies less likely to invest in new oil projects, equity investors and financial institutions are also less likely to support it. We will continue to require fossil fuels while we transition to renewable sources – we believe that underinvestment in its exploration and production will likely lead to higher prices in the medium term. This should hasten and encourage switching, but also lead to good cash flows for producers in the interim.
The same ESG pressures apply to coal. Diversified miner Teck Resources is the world’s second biggest exporter of steelmaking coal – a key ingredient of steel which is required for infrastructure development. Steelmaking coal also faces a dearth of new projects to replace ageing mines. We believe the market has not given them full credit for the development of a major new copper project in Chile. This project has been difficult and faced some overruns mainly due to Covid, but its start is imminent. We think Teck trades on a very attractive 15% normalised free cash flow yield.
Aluminium capacity growth has been almost solely concentrated in China over the past two decades. China now produces over half of the world total. Due to concerns over pollution, China has introduced a cap on aluminium production at just above current levels. Aluminium demand should continue to grow in the long-term, not least because of demand from electric vehicles. This demand cannot solely be met from increased recycling, and the lack of new projects outside of China is a concern.
In each of the commodity producers we own, we estimate the market price reflects commodity prices well below our estimate of equilibrium prices. If we are right, investors will be rewarded handsomely. As their balance sheets have been repaired, the downside risk (if we are wrong) is much less than the case a few years ago.
Some fixed income is (finally) worth owning
After being conservatively positioned in fixed income since the Fund’s inception, we have recently started adding to select positions. We have by no means adopted an aggressive stance, but with the most value on offer in a decade, we think the relative risk reward is tilting in investor’s favour. Specifically, we have been cautiously increasing duration, adding selectively to credit exposure, and buying inflation-linked bonds.
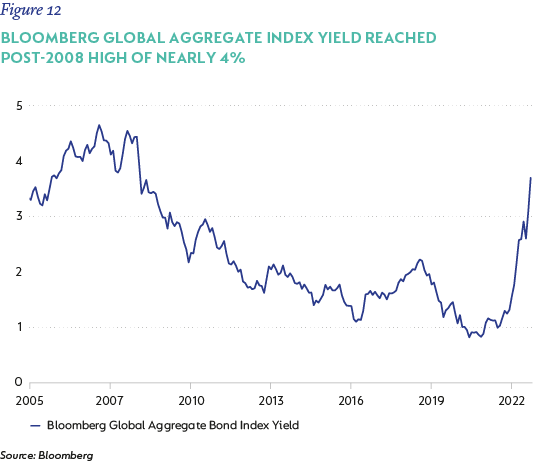
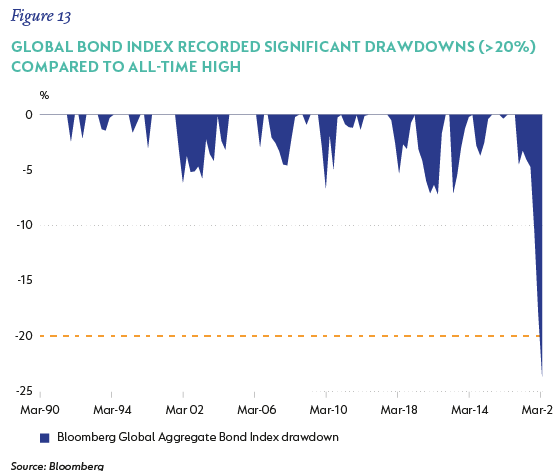
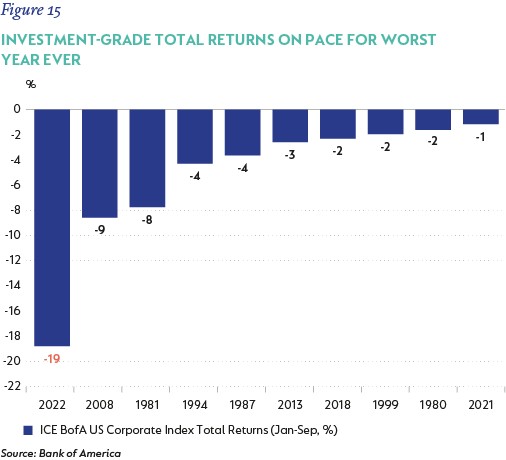
The charts below give a sense of some of the moves we have seen in fixed income markets.
After four decades of declining interest rates (which in the bond world implies rising prices), US 10-year government bond yields bottomed at 0.5% in 2020 before spiking to nearly 4% this quarter. Rising yields have driven significant drawdowns in the global bond index, with yields on the index ending the quarter at c.3.7%.
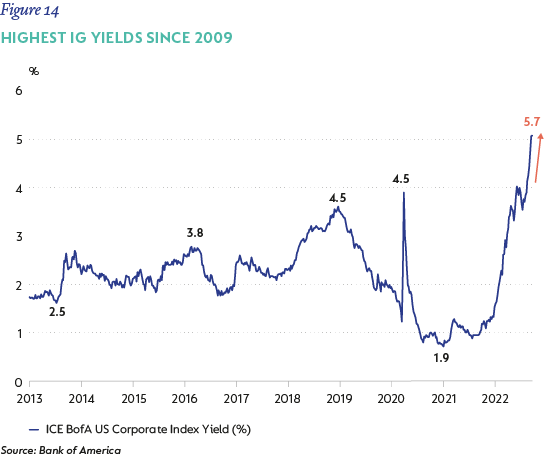
Corporate credit spreads have also increased, though are by no means in peak panic territory. When adding this spread to the yield from ‘risk-free’ government bonds, which themselves are meaningfully higher, we think there are opportunities to increase exposure to corporate credit. Investment-grade corporate credits as a whole ended the month of September with a yield to maturity of 5.7% - the highest since 2009.
To summarise our positioning, the Fund was positioned as follows at quarter-end:
- 69.1% in equities (which includes 11% in commodity and energy-related equities)
- 6.1% in real assets (which includes property and infrastructure investments)
- 1.9% in merger arbitrage situations
- 6.5% in high yield fixed income
- 8.6% in inflation-linked investments (which includes gold and inflation-linked bonds)
- 7.9% in investment-grade fixed income
Just as we said in the June 2022 commentary, you can have good news and you can have good prices, just usually not at the same time. Many headlines continue to be grim, but it is worth remembering the wise words of arguably the most experienced (and successful) investor – Warren Buffett – who in his 2008 Berkshire Hathaway letter said “the market value of the bonds and stocks that we continue to hold suffered a significant decline along with the general market. This does not bother Charlie and me. Indeed, we enjoy such price declines if we have funds available to increase our positions. Long ago, Ben Graham taught me that “Price is what you pay; value is what you get.” Whether we’re talking about socks or stocks, I like buying quality merchandise when it is marked down.”
As mentioned above, we are finding business values that are much higher than stock market prices, resulting in a portfolio that we think offers significantly more upside than normal. This leaves us optimistic about the Fund’s positioning and the potential for more attractive returns in the future.
Thank you for your continued support and interest in the Fund.
Please note that the commentary is for the retail class of the Fund. View the Global Managed Fund
[1] Products with 1 billion users are Google Search, YouTube, Android, Chrome, Google Play, Google Maps, Gmail, Google Drive and Google Photos.
Disclaimer


Explore Investment Insights on the global economy, markets and topics related to our business.
Subscribe to our Corospondent newsletter