 South Africa - Personal


Quo vadis?*
What a difference a few months make. By the end of the first quarter of 2018, the world was in a happy place. Emerging markets were forging ahead, generating bond returns of 4.4% and equity returns of 1.4% (both in US dollar terms), and synchronous global growth was the rising tide that would lift all boats. Fast forward to the end of the second quarter and tears of disappointment are rolling down the faces of most emerging market investors. The sweet nectar that enticed and fuelled an insatiable hunger for yield in developing markets started to sour towards the end of April. Emerging market assets tumbled, spurred on by concerns of an overheating US economy and fears around the escalation of a US/China trade war, in turn fueling a rally in the US dollar. This resulted in emerging market bonds and equities losing between 8% and 10% in the second quarter of 2018, bringing their dollar returns for the year to date to
-6.44% and -6.60%, respectively.
The spirit of ‘Ramaphoria’ that prevailed during the first quarter of 2018 lost its momentum. In part, this was driven by disappointing growth data and a slowdown in the pace of policy reform implementation (as highlighted in last quarter’s Bond Outlook). Coupled with the souring global environment for emerging markets, this resulted in the All Bond Index (ALBI) falling 3.8% in the second quarter of 2018, bringing its return year-to-date to 4% (marginally ahead of cash at 3.6%), but maintaining a solid double-digit return of 10.2% for the 12-month period. The South African 10-year government bond benchmark yield rose by almost 1% to 8.84% at the end of June (from its first quarter closing level of 7.98%), touching an intra-quarter high of 9.15%. The liquidation of bond holdings by foreigners resulted in a substantial swing in net bond flows, moving from a year-to-date net inflow figure of R17.6 billion (at 31 March 2018) to a net outflow of R35.6 billion (at end-June 2018). This had a significant impact on the exchange rate, with the rand weakening by 13.7% over the quarter.
POSITIVE LOCAL BACKDROP FOR SOUTH AFRICAN BONDS
The local economy has endured an extended period of underperformance relative to global markets and its peers in the emerging market universe. More recently, many of South Africa’s self-imposed obstacles have started to show signs of clearing. Inflation remains at a cyclical low and should not exceed the top end of the South African Reserve Bank (SARB) target band (3% to 6%) over the next 12 to 24 months. In fact, current inflation expectations are closer to 5% than 6%, according to the latest Bureau for Economic Research Inflation Expectations Survey. Growth numbers for the first quarter of 2018 surprised materially to the downside (-2.2% quarter on quarter and 0.8% year on year), calling into question the realism of the ‘Ramaphoria’ effect. This implies that the SARB has room to provide more cyclical support to the local economy by further easing the repo rate; however, considering the recent rout in emerging markets, the worst-case outcome is that the repo rate remains stable for at least the next 6 to 12 months. On the growth front, although most recent data are cause for concern, real consumer income growth will be closer to 2% this year, allowing for an additional recovery in consumer spending, which makes up about 60% of GDP. Long-term growth prospects will rely on an increase in fixed investment into the local economy, which can only be realised in a certain and transparent policy environment. The conditions thereof have been partially met with the new administrative team in government and newly announced policy reforms – although these reforms are likely to be implemented at a much slower pace than suggested at the start of the year. This leaves the South African economy in a very favourable position relative to its peer group, with growth heading higher and inflation being stable (or lower), thereby creating a supportive environment for local bonds.
Despite the positive local backdrop for South African bonds, the global environment has become unsympathetic as global monetary policy accommodation continues to be wound down. As such, the price one pays for South African government bonds should encapsulate a decent margin of safety to weather short-term market volatility. There are two key measures through which to assess the value in local bond markets; first, by comparing the implied real yields of local government bonds relative to their emerging market counterparts as well as their own history, and secondly, by establishing whether current yields provide a sufficient margin of safety should one of the key underlying drivers (the one that is currently most at risk) experience an abrupt, adverse move.
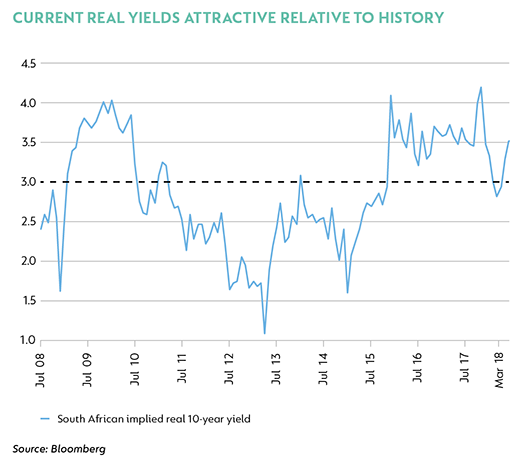
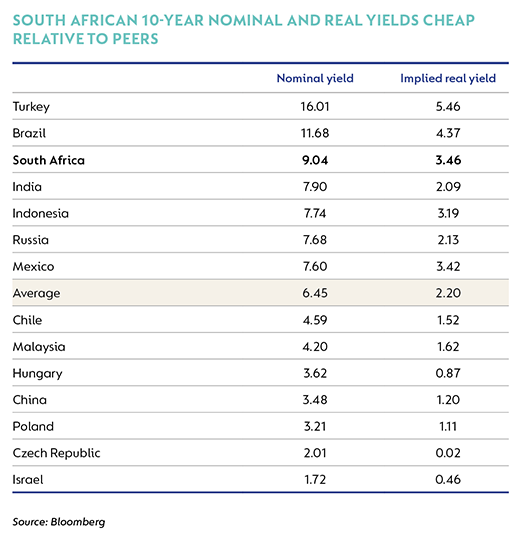
In the graph and table below we compare the implied real yield of the South African 10-year benchmark to its history and relative to its emerging market peers. We arrive at the implied 10-year real yield by adjusting the nominal 10-year yield for the average actual realised inflation over the two years after the observation point (we use a combination of market and internal forecasts for those periods where this is not available).
As an example, a nominal 10-year yield of 9.04% at 29 June 2018, adjusted by an expected inflation average of 5.1% over the next two years, implies a real yield of 3.46%. Two things are clear from this exercise. First, the current level of real yields in South Africa is attractive relative to history. The graph below shows that real yields are sitting above their 10-year average and are as high as they were during previous times of locally driven economic and political stress. Secondly, relative to our emerging market peer group, South Africa flags as one of the cheapest stable emerging markets, both from a real and nominal yield perspective. We remind readers that both Brazil and Turkey are at very different points in their respective business cycles to South Africa and are going through a period of unsettling economic and political stresses. Therefore the relative valuation of South African government bonds seems relatively cheap.
To arrive at a fair value for South African government bonds, one must take into consideration the following three things:
- the level of the global risk-free rate;
- the inflation differential between South Africa and the rest of the world; and
- a credit spread that quantifies the inherent risk in South Africa as an issuer among emerging markets.
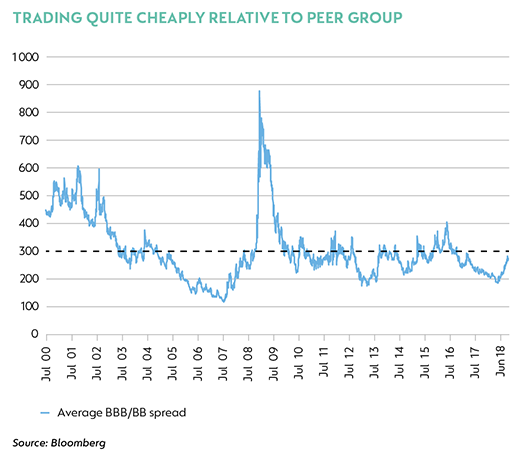
We can objectively say that the current level of the South African 10-year bond is 9.04%, the global risk-free rate is 2.86% (US 10-year) and the inflation differential is sitting at 3% (local inflation of 5% and US inflation of 2%). This implies a credit spread of 318 basis points (bps) for South African government bonds. The graph below shows the average credit spread for BBB (investment grade) and BB (first rung of subinvestment grade) borrowers. It must be noted that South Africa has a split credit rating, with Fitch and Standard & Poor’s holding a subinvestment grade rating while Moody’s holds an investment grade rating for South Africa. The current level of the average credit spread in the graph below is 270 bps, with a long-term average (the black dashed line) of 300 bps. We conclude from these observations that South Africa trades quite cheaply relative to its peer group. Even if credit spreads were to normalise further as global monetary policy conditions tighten to long-term averages, the country’s current credit spread provides sufficient room for a cushion against this normalisation, given that it currently trades well above the long-term peer group average.
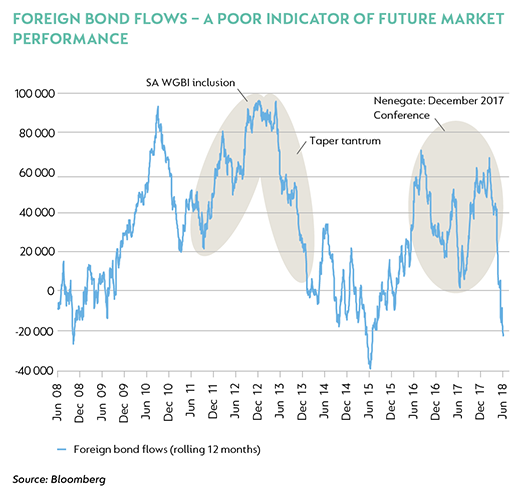
Foreign flows into the local bond market garner a great deal of attention due to their magnitude, but they do not form part of the foundation of our investment case for bonds. We focus on the pricing of risk rather than the psychology surrounding risk. Nonetheless, looking at the trends does provide some insights. The current level of outflows, on a rolling 12-month basis, is equivalent to the level of outflows that the bond market experienced during the period May to June 2013 (the ‘taper tantrum’) and in the aftermath of 9 December 2015 (‘Nenegate’). There are two key observations to be made from the graph below:
- Foreign flows in/out of the local bond market are generally driven by momentum (buying as the market becomes more expensive, or selling as it becomes cheaper), making them a bad indicator of future market performance.
- Given the degree of selling that has been experienced over the last 12 months (more specifically in the last 3 months), positioning seems a great deal cleaner (that is, not biased to a sell-off or rally in markets). This further suggests that big moves going forward are more likely to be valuation based rather than sentiment/positioning based. This further adds credit to our assertion that from current levels, bond yields are more likely to compress (bond rally) than widen (bond sell-off).
South Africa has made the mistake of looking through rose-tinted glasses for the better part of this year, with asset prices reflecting a much too optimistic outlook for local economic developments. The recent economic disappointments on growth have been a stark reminder of the local economic reality against a global backdrop that has turned more treacherous for emerging markets. South Africa’s underlying economy remains in a better place relative to history and to its peer group. Inflation is expected to remain stable and well contained, while growth will continue to move higher. Local bonds have now adjusted to reflect realistic expectations for the local economy and the more unfriendly global environment. South African bonds compare favourably to their emerging market peers relative to their own history, and offer a decent cushion against further global policy normalisation. At current levels, the yields on offer in the local bond market are attractive relative to their underlying fundamentals and warrant a neutral to overweight allocation.
* Moving in a herd has its advantages. It is difficult to get lost; all you have to do is stick to whoever is in front of you. Following the herd works out for some, but not for others. Large fluctuations in the market always tempt investors to follow the herd. Nevertheless, as in the lemming metaphor so widely (ab)used, sometimes staying with the herd can be the first step towards the afterlife.
Coronation’s proprietary research process, which has a 25-year track record, focuses on deep, insightful research into the long-term fundamental drivers of the local economy and the pricing of assets based on the long-term prospects for the economy. This ensures that our investment decisions are independent, durable and based on our assessment of long-term value for our client portfolios.


Explore Investment Insights on the global economy, markets and topics related to our business.
Subscribe to our Corospondent newsletter