 South Africa - Personal


Investment views
Stress testing worst-case scenarios
Assessing asset class performance in weak state regimes
The Quick Take
- Extended periods of momentous countrywide decline typically upend asset class behaviour
- In severe instances, the best option for savers has been to divert capital into alternative jurisdictions… but what about local assets?
- Across a range of such episodes with different causes and effects, equities repeatedly demonstrate superior wealth preservation attributes
- South Africa remains several steps removed from the extent of macro instability and currency debasement seen in such episodes…
- … but if meaningful policy and institutional failure were to occur in future years – akin to the cases examined – a strong bias to equities would be the favoured onshore asset allocation

Dystopian and post-apocalyptic fiction tend to surge in popularity when humanity faces some form of existential threat or crisis. Examples include the post-World War II sub-genre of atomic bomb-centred apocalyptic fiction and then again in the 1980s, spurred by the escalation of the Cold War. The Covid-19 pandemic is the most recent contemporary single global event to trigger a cascade of art drawing on dystopian ideas. More recently, geopolitical ructions and climate change apprehension have picked up the mantle for doomsday inspiration.
Fascination with portentous narratives isn’t surprising as they are just reflections of the times. Indeed, this is probably the common thread of all dystopian fiction – amplifying the fears and problems of a society and reflecting them back. It is in this spirit that the analysis presented below should be read. As custodians of client assets, we are always considering downside risks and always examine worst-case scenarios for maximum downside risk – irrespective of how diminutive the probability of such scenarios materialising may be.
One such scenario is an extended period of severe countrywide decline to the point of major macroeconomic instability, typically accompanied by one or more financial crises. Yet, inherently, the specific nature of any crisis determines the consequences and, more precisely, its effect on asset prices. So, the consideration of a generic, unspecified period of countrywide stress might seem particularly unhelpful. Yet there is one – highly significant – exception to this. And that’s the impact on relative asset class performances.
In periods of meaningful macroeconomic instability or acute sovereign distress, the typical long-term performance ranking of asset class performance can become upended. This doesn’t refer to the usual cyclical rotation of asset returns or other short-term effects that can shuffle asset class leadership around on a temporary, year-to-year basis. Rather it refers to a more pronounced distortion of the broader regime overarching the pricing and subsequent performance of entire asset classes over more sustained periods. Usually, this alternative context is driven by a profoundly distorted macroeconomic environment, typically associated with unsustainable monetary, fiscal, industrial or exchange rate policies.
For the episodes of interest to us, the reach of these policy distortions tends to be complete. There is rarely an untouched corner within the particular sovereign or currency jurisdiction that isn’t directly affected. Indeed, this is one of the few unifying features of such episodes: they are characterised by pricing and performance distortions across all asset classes.
These episodes differ substantially in their root causes, manifestations and, ultimately, also their resolutions. By considering a selection of such events across a range of countries, we can gain insight into how such a scenario might unfold in the South African (SA) context. However unlikely this may be. And, even more pertinently, the common outcomes of such diverse and heterogeneous examples of prolonged sovereign instability may prove the most useful when thinking about investment portfolios facing the prospect of an extended period of countrywide decline.
SOME CASES IN POINT
We’ve selected several countries to help illustrate the key generalisations of this exercise, and also to highlight several idiosyncrasies and noteworthy peculiarities that can arise in such scenarios.
Our core case studies presented here include the following: Argentina, which is a perennially weak country. Here, both broken sovereign creditworthiness and extremely high inflation come under the spotlight. Turkey provides for a relatively idiosyncratic backdrop, with a litany of unorthodox policies littering its recent past – but despite this, ably demonstrates some of the common conclusions around domestic asset allocation under a weak state regime. Brazil presents an interesting and complex case study; only a few key elements are highlighted here out of what is a rich and convoluted parable of sovereign decay and revival.
As addendums to this article, we extend our analysis to Egypt, which is potentially a situation that is still very much in motion. Here, external vulnerabilities are a key component, and this feature helps illustrate outcomes particular to this type of macroeconomic instability. We also look at Sri Lanka, which, as a current sovereign defaulting nation, provides numerous lessons, most particularly about asset class degradation over time; while Zambia and Ghana are recent examples of fiscally irresponsible nations that reached the end of the road (at least, this time). And finally, we examine extreme, failed state examples in the form of Venezuela and Lebanon, which illustrate the corner solution of what materialises in the worst-case outcome.
ARGENTINA
Argentina has an extensive history of economic crises and boom/bust cycles. The latest period arguably started in late 2016, which marked the full and complete restoration of Argentina as a non-defaulting sovereign. With a pro-market government in power enjoying solid popular support and a recently devalued exchange rate, this was a moment of hope for genuine renewal and reform for Argentina. And, for around two years, there was a relative period of stability and progress in tackling the many underlying impediments to sustainable growth and low inflation.
However, poor economic growth, sticky inflation, and an unsustainable debt build-up derailed progress and, even with the largest IMF loan in history, economic conditions continued to deteriorate. Covid-19 accelerated this decline meaningfully. The inability (and lack of willingness) to consolidate government spending combined with extensive fiscal monetisation saw a precipitous currency devaluation – both internal and external. This progression is accurately portrayed in Figure 1, which illustrates the cumulative total return outcomes of the primary asset classes, denominated in the Argentine peso (ARS).
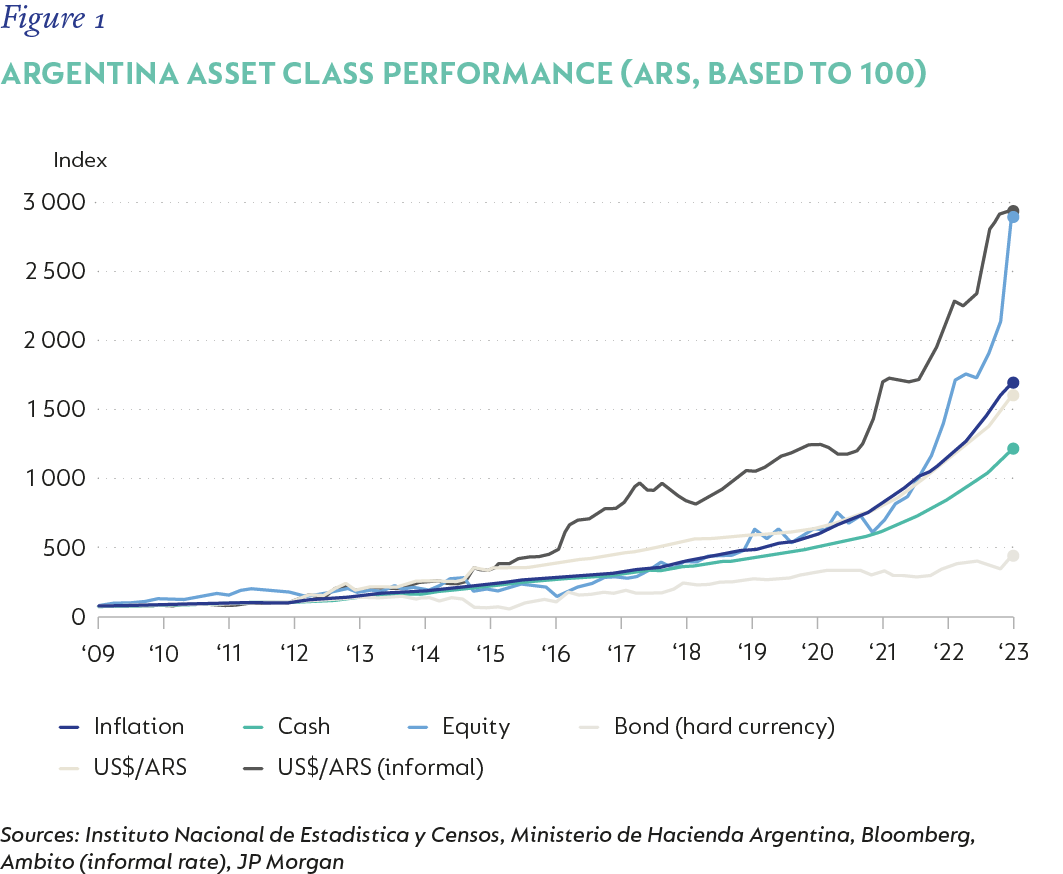
Figure 1 shows how, from the onset of Covid, external valuations of all Argentinian assets declined in real terms. Local bonds were the underperformer, unsurprisingly, given the additional sovereign default in 2020. Cash was next, becoming progressively debased over 2021 and onwards. Equities essentially only managed to retain a flat real value from 2019 into 2022. However, over the course of 2022/2023, they staged a substantial recovery in both peso and US dollar terms, significantly bolstering their long-term performance. By end-July 2023, the cumulative total return from December 2016 was only -0.4% p.a. behind the aggregate depreciation of the currency (as measured on the informal market[1]).
Bear in mind that 2016 marked the peak of optimism for Argentina as a reform candidate and is hence quite a distorted base. If looking at the aggregate US dollar total return of the Argentinian stock market taken from three years prior (Dec 2013), this moves to +6.1% p.a. – which obviously pales in comparison to the S&P Index (+12.1% p.a.) over the same period, but is noticeably better than that of the broader peer group, the MSCI Emerging Market Index, at +3.3% p.a. And, following a general election in October 2023, with its unexpected results and the new government’s official devaluation of the peso by more than 50%, the pre-existing trends in relative asset class performance were extended further.
Case in point: In an instance of severe currency debasement, assets with real economy linkages (e.g., equities and real assets) are those that provide sustained preservation of real value, whereas asset exposures with primarily nominal linkages (e.g., fixed income) fall progressively further behind.
TURKEY
Turkey has a complicated economic history, especially from the early 2000s onwards. The golden period for Turkey’s modern economic record lay between 2006 and 2017. Ambitious reforms and high growth rates boosted the country well into the higher reaches of upper-middle-income developing nations while reducing poverty. But there were many conflicting and sub-optimal elements about the sustainability of Turkey’s growth model. Indeed, reform momentum slowed over the years and there was an increased focus on supporting growth through stimulus measures, especially credit surges. Not necessarily problematic, but without corrective actions over time, both internal and external macroeconomic vulnerabilities intensified. In combination with increased economic unorthodoxy, a byzantine political environment and increasingly authoritarian leadership, Turkey’s imbalances of high private sector debt, persistent current account deficits, high inflation, and high unemployment cascaded into persistent macro-instability from mid-2018 onwards.
This remains Turkey’s struggle today, with the long shadow of Covid-19 and the Russia/Ukraine war further complicating the authorities’ oblique efforts to regain macro-stability. While recent developments may signal a return to more orthodox economic policies (i.e., away from fiscal monetisation, ‘re-liraisation[2], excessive reflation and financial repression[3]), there have been many false dawns for Turkey before and scepticism remains understandably widespread.
Figure 2 shows the returns of Turkish asset classes since 2009 in Turkish lira (TRY) and provides a snapshot of Turkey’s slide further and further away from the norms of a conventional developing economy growth and policy framework.
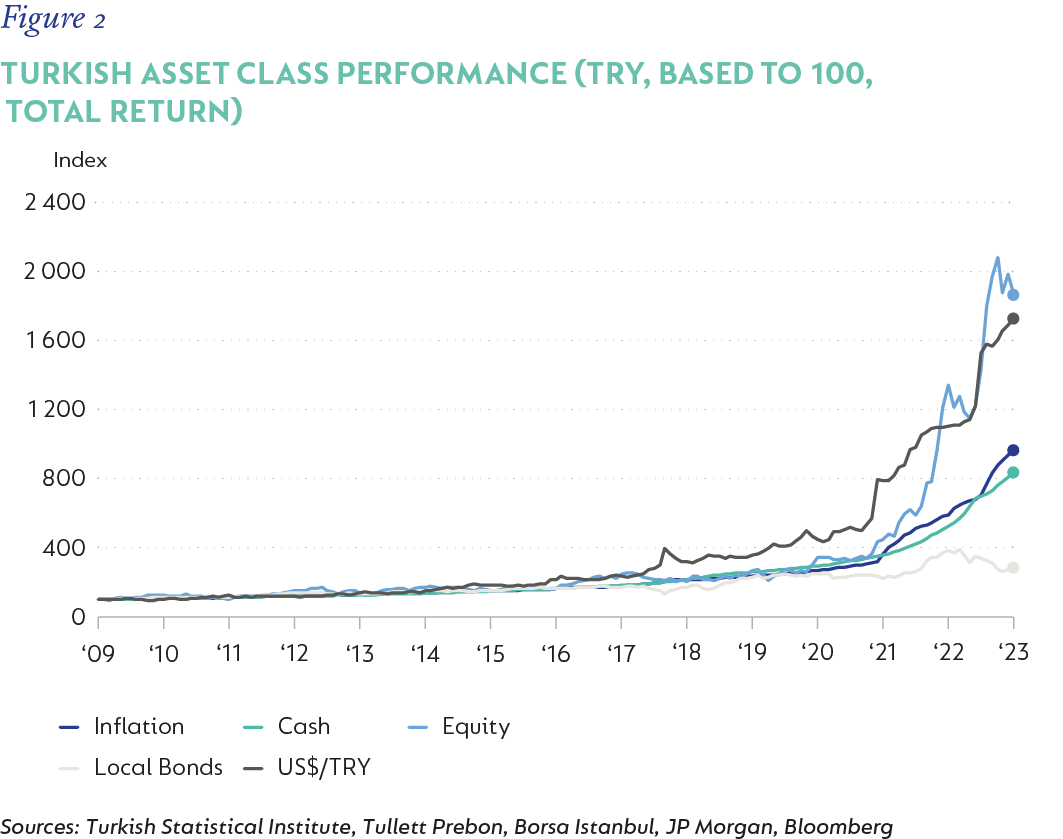
There are a few key features of this progression to highlight:
- The external valuation of all Turkish asset classes fell before anything else changed[4]; and poor foreign exchange and monetary policy adjustments, the erosion of reserves, growing external vulnerabilities and foreign capital flight served to suppress domestic asset performance and exacerbate currency weakness.
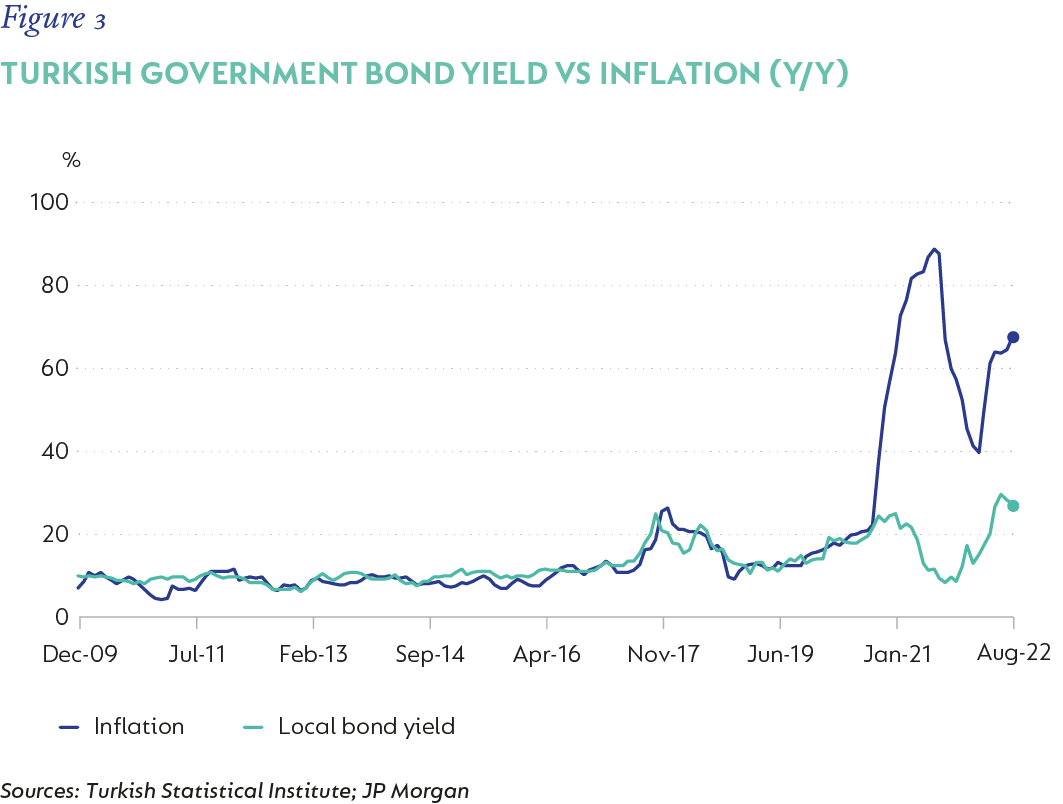
- Among the asset classes, local bonds started to lag the performance of cash. Partly a result of the reactionary need for high, real short-term interest rates inverting the yield curve, and partly due to increased fiscal concerns, the need for a higher country risk premium in sovereign assets and, increasingly, the imposition of financial repression by the Turkish authorities by suppressing local yields. The full, real impact of the latter set of policy adjustments is evidenced in Figure 3, which shows the sharp puncturing of the real debt burden by Turkey following the recent explosion in inflation. What had been a reliable preserver of (local) purchasing power for years on end – even through ostensibly more threatening episodes – was undone in a matter of months.
- Third, with Turkey's heightened external vulnerability, elevated short-term interest rates have proven crucial (even if despised by the political leadership) as an offset. The net result is that, even if cash returns have been negative in external terms, these have been cumulatively only modestly negative in local, real terms to date.
Case in point: The aggregate performance of Turkish equities – in both local and external currency terms – has been head and shoulders above that of the other primary asset classes. Since December 2009 until December 2023, Turkish equities have returned c. 0.6% p.a. in US dollar terms; not impressive by any measure – but the only primary onshore Turkish asset class to preserve value in hard currency terms.
BRAZIL
Brazil presents a particularly complex case study. A survey of Brazil’s macroeconomic, political, and financial history makes for fascinating reading. Yet it is important to narrow our focus to the most relevant question for this exercise: has Brazil upended the conventional ordinal ranking of asset class performance and, if so, is this of bearing within the SA context?
The simple answer to the first part of the above is yes. Brazil has a history of long-term asset class performance, which maintains a standard structure: cash, with a long-term real positive return; local bonds, cumulatively outperforming cash over most long investment holding periods; and aggregate equities, cumulatively delivering low real returns and trailing both cash and duration fixed income assets.
Figure 4 demonstrates this clearly in Brazilian real (BRL) terms. With Brazil having faced significant challenges and still very much struggling to regain a sustainable macroeconomic footing, this certainly qualifies as a materially tough period with a non-standard asset class performance outcome. Just as remarkable, is that domestic bonds are the only onshore Brazilian allocation that has persistently provided preservation and growth in external valuation terms over the long term in Brazil.
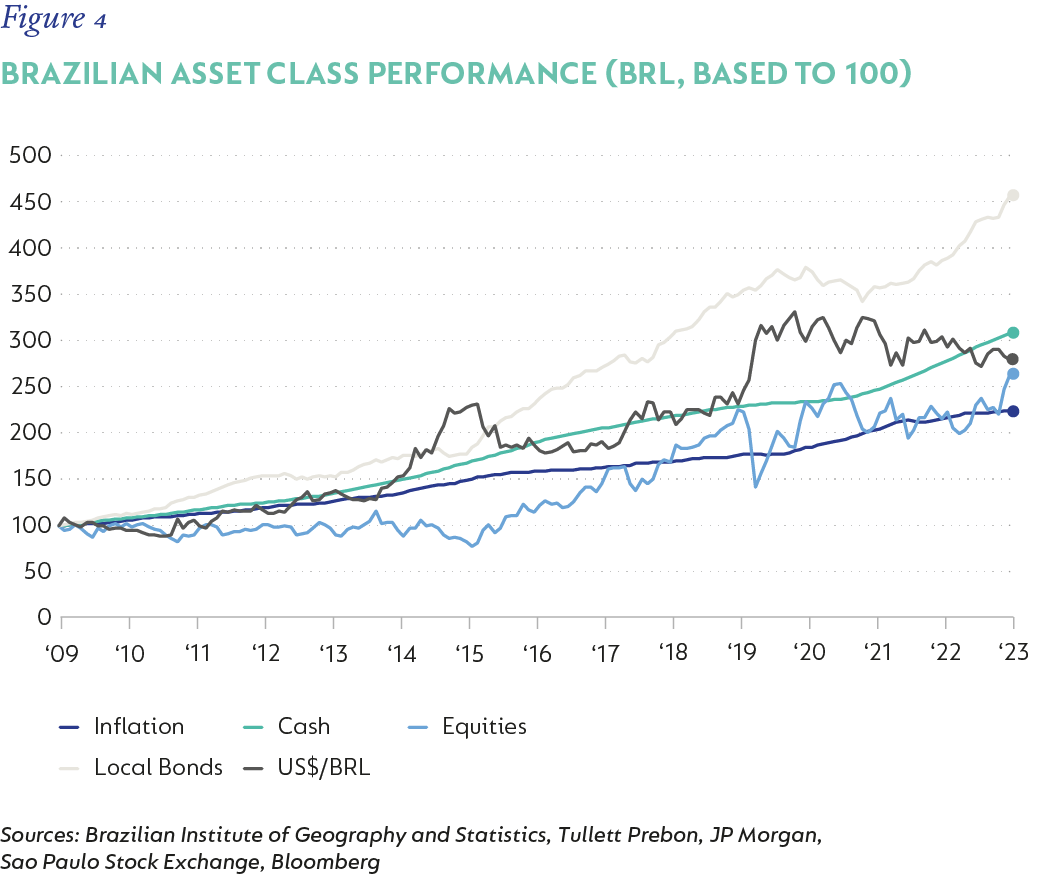
So, what has occurred here, and is this generalisable?
There are two key elements to this case study. The first relates to base effects – which are exceptionally significant in the case of determining long-term equity outcomes through Brazil’s recent history. Figure 5, showing the total return from Brazilian equities ( Sao Paulo IBrX Index) reflects three chapters of particular significance: 2002-2008, 2008-2018, and 2018-2023. With the election of Lula da Silva in 2002, Brazil progressively leapt from strength to strength. It was genuinely a Golden Era for the country, coinciding with the apex of a multi-decade, secular increase in global liquidity.
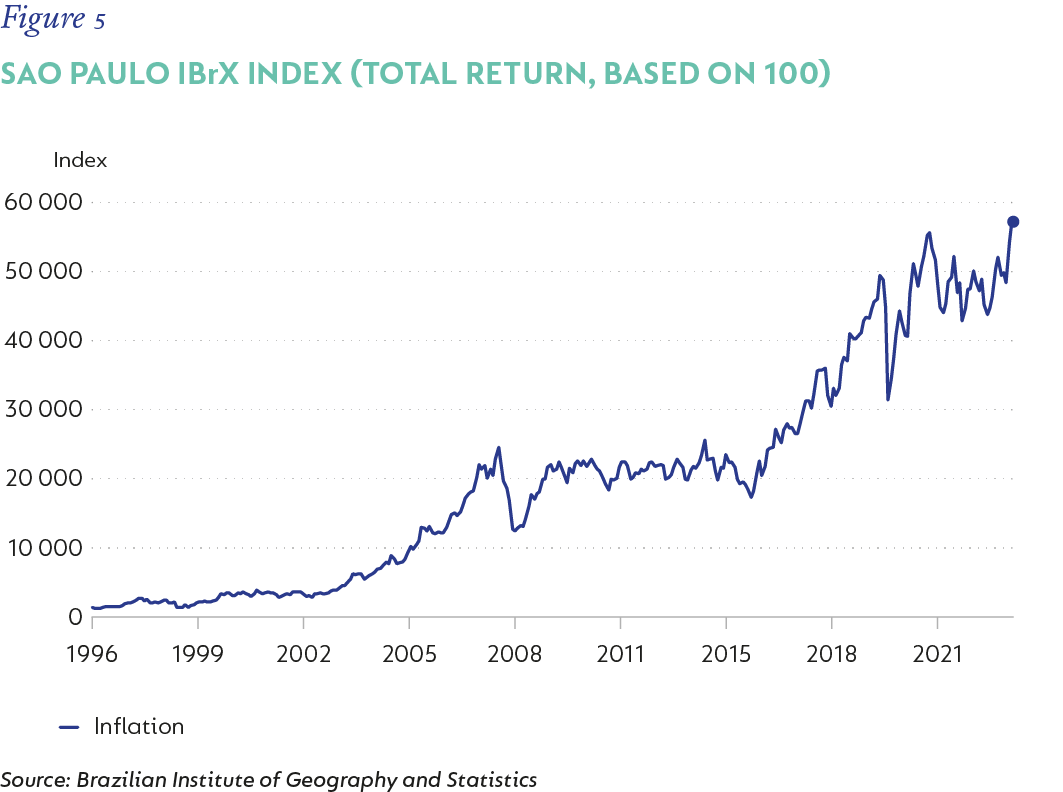
This resulted in arguably one of the largest bubbles seen at this time within the emerging market asset class – Brazil and all her assets – and which came to a very abrupt end during the Global Financial Crisis. The combination of deteriorating policies, unsupportive politics, and a colossal valuation overhang in the Brazilian stock market (which had returned c. 48% p.a. between 2002-2008) was more than enough to cause stagnation in nominal terms for the better part of the following decade. This meant that investing any time between 2008 and mid-2015 in the IBrX would see this allocation underperform Brazilian domestic government bonds for a holding period up until the present. However, from mid-2015 onwards, there were significantly more incidences (indeed, extended periods) where equities delivered superior outcomes to local bonds.
But it hasn’t just been about an enormous equity market bubble colliding with a flawed growth model and intricate politics. Brazil has long maintained a particularly rarified status among other emerging market countries of consistently sustaining unusually high real rates. This phenomenon alone has been the subject of significant conjecture and analysis over the years. For the current purposes, the causes of this feature aren’t the focal point; rather the mere scale and longevity of Brazil’s high real rates is the significant element. Figure 6 illustrates this adeptly.
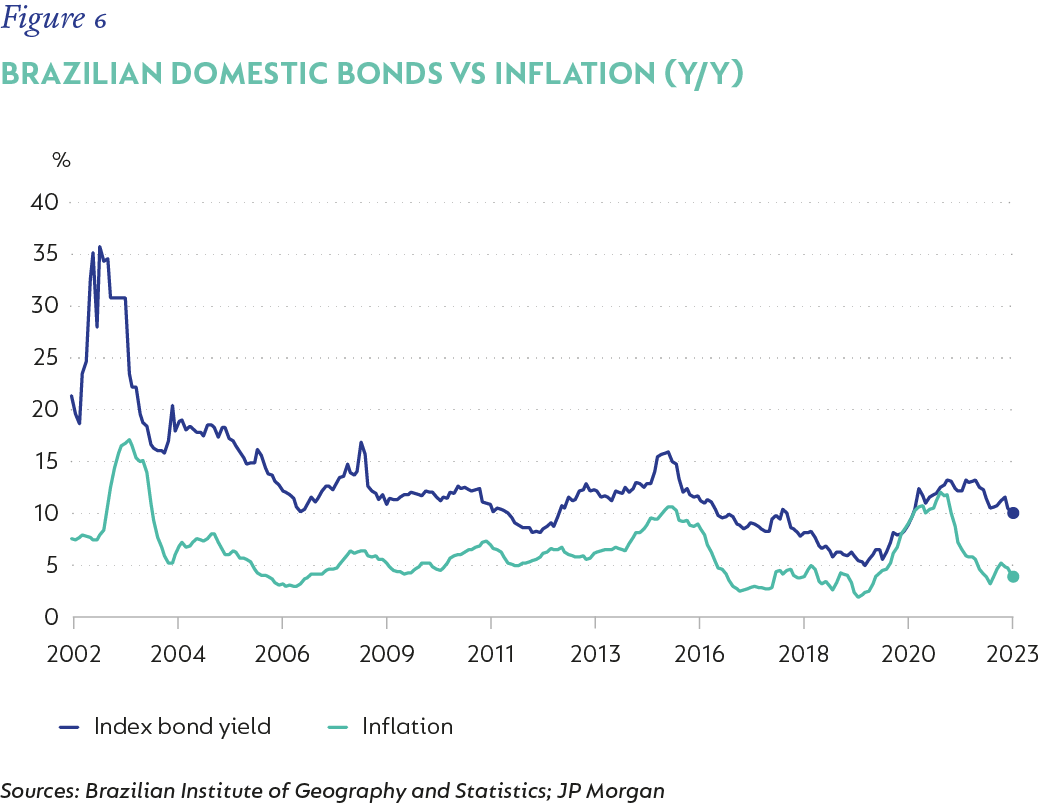
Case in point: While an allocation (randomly assigned) to Brazilian equities from mid-2015 onwards would typically deliver long-term outperformance, the noteworthy part is just how competitive an investment in Brazilian government debt has been, on a relative basis. Whether this has provided adequate compensation for the risk assumed when facing a fiscally challenged sovereign issuer is hotly contested – and arguably still remains an unresolved question.
SOUTH AFRICA
Figures 7 and 8 both depict the stack up of the current long-term performances of SA asset classes versus inflation, in rands, between December 2009 to December 2023.
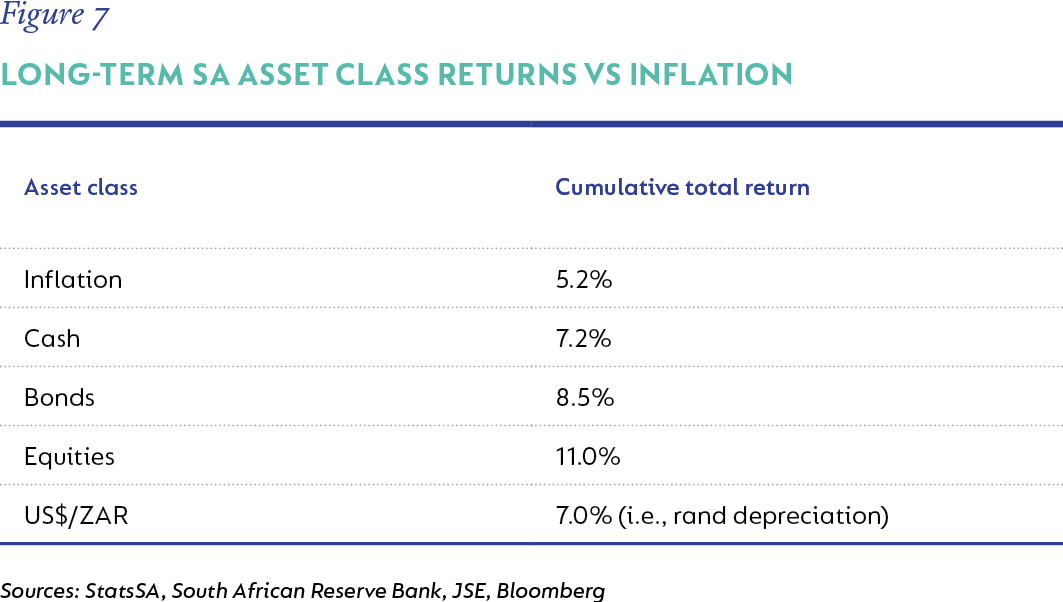
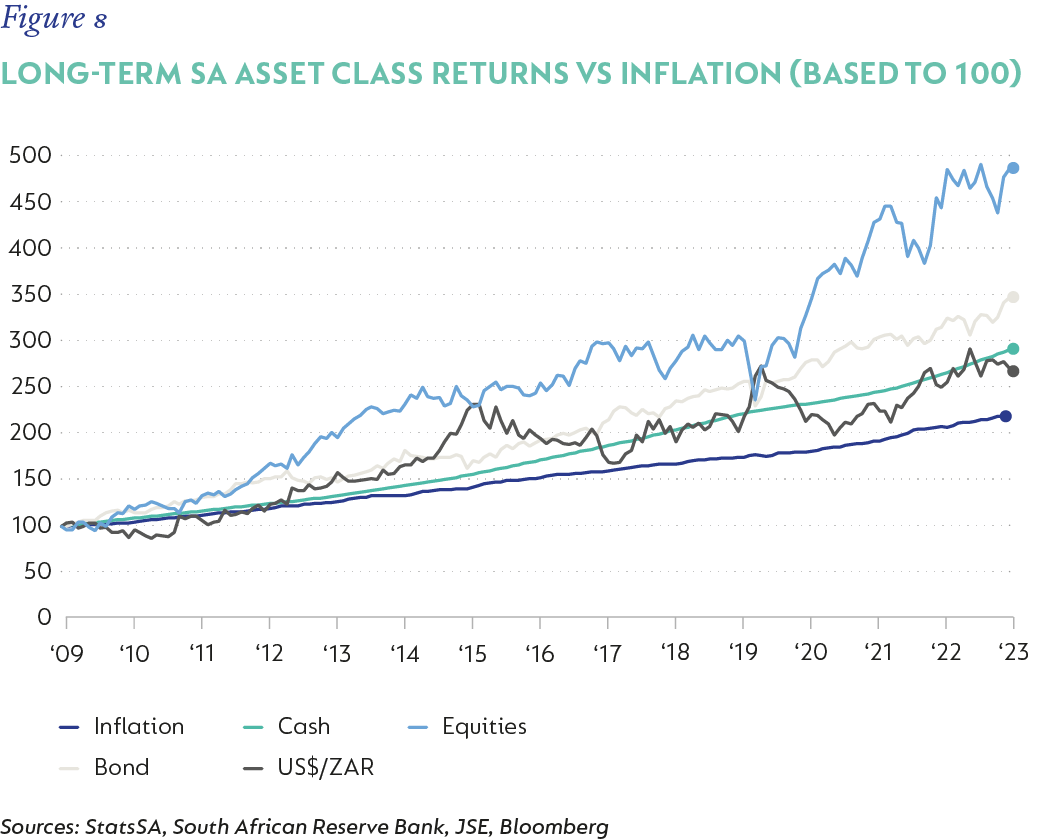
In one sense, this is a textbook outcome. Inflation has remained modestly above the 3%-6% target band mid-point, on average, over the past 14 years. Cash has provided a long-term real return of +2% and local bonds have provided an additional 1.3% p.a. pick-up to cash over the entire holding period. Arguably, the latter has been too low for the risk assumed; but this is a contestable point, and the key point is that bonds have consistently outperformed cash throughout the period. The depreciation of the rand (bilateral basis, vs the US dollar) has tended to gravitate to long-term levels between inflation and cash rates – this is a largely satisfactory outcome. Finally, the SA equity market has demonstrated significantly more volatility relative to the other asset classes and has produced superior long-term returns, mostly with a fairly consistent and sustained outperformance. With a real return of c. 5.8% and a spread over cash of 3.8%, one can quibble about the fundamental risk premium provided by the JSE’s long-term performance, but at least the appropriate ordinal performance ranking is faithfully maintained and real returns – whether in rand or hard currency – aren’t unfathomable or completely unreasonable.
There is a second element to the SA context that is exceptionally important. Indeed, while having already played a role in past performance, in the event that SA’s macroeconomic and policy climate continues to deteriorate, the disassociation that the listed SA equity universe has from the SA economy will likely be even more evident than it has been. After all, for various historical reasons, there is an unusually large separation between the investment selection available on the JSE and its representation of the SA domestic economy.
There are various ways to measure this, but the core message is very much uncontestable.
- By market capitalisation, the JSE is essentially made up of c. 86% non-SA economic exposure.
- By operational exposure, this is currently c. 80% non-SA exposure.
- Looking at earnings – on a gearing and translation basis – c. 58% of the market is non-rand.
- Pure SA economic exposure (i.e., significant, direct fundamental exposure to the SA macroeconomy) makes up only c. 7% of the JSE by market capitalisation.
Whichever way you look at it, on aggregate, the JSE doesn’t especially offer high exposure to SA-only. Indeed, the top eight equities by market capitalisation (c. 70% of the total market) are BHP Group, Prosus, Anheuser-Busch InBev, Richemont, Naspers, British American Tobacco, Glencore and Anglo American. These companies all have relatively low exposure to the SA economy relative to their overall earnings, balance sheets, and operational and risk exposure bases. This is a highly significant element when considering both absolute and relative prospective asset class outcomes under various long-term macroeconomic scenarios for SA. It would be very hard to separate the fortunes of SA fixed income assets from that of the country – but this needn't be anywhere near the case for equities.
Naturally, there are additional considerations such as facets of jurisdiction; the future composition of the JSE; non-fundamental (or non-corporate) elements impacting asset returns; tax policy and potential financial repression; and prescribed asset hurdles to navigate in SA’s particularly adverse policy landscape. These are likely to only manifest as headwinds to equity performance; yet may still prove secondary to the wealth-preserving dominance of equities as an asset class.
BROAD GUIDELINES FOR ASSET ALLOCATION
In the case of an extended period of countrywide decline – which can manifest in numerous ways – there are some broad guidelines that domestic investors should consider in their asset allocation processes.
- In periods of significant, country-specific decay and mismanagement, the optimal choice will always be maximising true (i.e., jurisdictional) offshore asset exposures, on a non-hedged basis.
- Among domestic onshore asset classes, equities have a strong tendency to outperform over extended holding periods.
- In episodes of exceptional currency debasement (persistent very high or hyperinflation), the outperformance of equities over nominal instrument exposures is profound. This isn’t just because real assets with real economy linkages are better conduits for fundamental value preservation, but that, as traditional stores of value are undermined, there are often additional premiums placed on the remaining candidates.
- In episodes of persistent stagnation (low growth, but without corrosive levels of inflation), domestic equities can underperform other domestic asset classes for longer than cyclical norms. Substantial deterioration to the point of currency debasement thereafter typically sees outsized equity recoveries.
- For countries with significant external vulnerabilities, especially those with high levels of external public debt, there is often a need to sustain especially high real short-term interest rates as both a stability and funding mechanism in periods of economic weakness. This can prove beneficial for short- to medium-term investment horizons and provided there isn’t a subsequent significant internal or external currency devaluation.
- Of the primary asset classes available to domestic investors, only equities have the potential to be significantly more removed from the hard machinations of the domestic macroeconomy and policy climate. This can vary meaningfully from country to country and may only be partially under the domestic investor’s influence – but time and time again, under all sorts of difficult circumstances, equities demonstrate superior wealth preservation relative to other primary asset classes.
Case in point: It is undeniably comforting to contrast SA’s standing with that of weaker states – despite the catalogue of past policy missteps and the myriad challenges facing the country. From a macro-stability perspective, SA remains quite a few steps removed from the case studies outlined here. In one sense this has echoes in why post-apocalyptic fiction rises in popularity during particularly troubled times, since this is a way for people to absorb potential outcomes that are far worse than those actually being experienced. But aside from the cathartic benefits that dystopian fiction provides (and hopefully our case study analysis!), there is another parallel here. By working through what a fall into the abyss might look like, it reaffirms the importance of valuing what we currently have and the need to sustain the struggle to preserve it.
[1] The informal currency market is typically the best measure to use in such broken economies. Essentially, it is the rate at which an average citizen could secure hard currency
[2] Turkey is trying to decrease reliance on developed market currencies (US dollar and the euro) and increase the use of the lira in the overall economy
[3] A debt control measure whereby government implements policies that aim to control the market and private and public sector institutions to facilitate cheap government borrowing. It may provide government with short-term relief; but at the expense of citizens, and is ultimately detrimental to economic health
[4] Where currency weakness superseded any local return performance of Turkish assets
Disclaimer
SA retail readers
SA institutional readers
Global (ex-US) readers
US readers


Explore Investment Insights on the global economy, markets and topics related to our business.
Subscribe to our Corospondent newsletter